Traffic Analysis on Google Maps with GMaps-Trafficker - TECHNICAL WHITE PAPER
←
→
Page content transcription
If your browser does not render page correctly, please read the page content below
TECHNICAL
WHITE PAPER

                                                 Traffic Analysis on Google Maps
                                                            with GMaps-Trafficker

              Abstract

              This paper describes a high-level approach to identifying which geographical
              coordinates a user sees on Google Maps when utilizing an SSL-encrypted channel.
SSL Traffic Analysis with GMaps-Trafficker

Overview
   Provided you have built the correct profile, the GMaps-Trafficker tool allows you to identify
   which geographical coordinates a user is looking at on Google Maps even though the user
   is accessing Google Maps over SSL.

   This proof-of-concept tool was developed in response to explaining SSL traffic analysis to
   several IOActive customers. Although many papers have been published in the last decade
   on this topic—written by reputable research outlets including Microsoft Research—there
   hasn't been much to show in the realm of usable, real-world tools and/or source code. To
   meet this need and to more clearly illustrate the issue to IOActive's customers, this proof of
   concept tool was developed.

   It features a simple library built on libpcap and libnids. On top of this library, the tool
   itself has the ability to perform traffic analysis of Google Maps sessions running over an
   HTTPS connection. Please note, the code is rough around the edges and will be released
   in a month or two; so, if you're interested please contact Vincent Berg at
   vberg@ioactive.com.

Google Maps Explained
   The technical basics of Google Maps in your browser are actually quite simple: there's
   window in your browser whose height and width depend on your browser window and,
   subsequently, your screen size. The Google Maps API loads what are referred to as tiles,
   as shown in Figure 1.

                                            Figure 1

   Tiles. Tiles come in many types including satellite, map, and overlay tiles, the last of which
   show country, city, and street names by loading these transparent PNG tiles over the
   underlying map tile. The underlying map tile can be either a satellite or a map tile. Our
   proof-of-concept tool works only with satellite tiles even though there's no particular reason
   why it could not work on normal map tiles with caveats applied.

   Encoding. Encoding applies to the zoom level and the coordinates. Google Maps uses a
   x,y,z encoding to encode latitude-longitude pairs and zoom levels into x,y,z values, which

   Copyright ©2011 by IOActive, Incorporated. All Rights Reserved.                             [1]
SSL Traffic Analysis with GMaps-Trafficker
refer to one specific location. To load the satellite tile for location (x=1,y=2,z=3), the Google
Maps API performs an HTTP request to a URL on something like:
https://khms0.google.com/blablabla?x=1&y=2&z=3.
SSL Traffic Analysis
To perform SSL traffic analysis, you must be able to identify corresponding TCP sessions
and merge packets (either from an offline PCAP file or live capture sessions) into a correct
data stream—this means correct packet reassembly, and GMaps-Trafficker uses libnids.
Next, you need to parse the SSL structures—for the actual traffic analysis we're not
interested in the algorithm handshake at the beginning or at SSL alert messages, we're
interested only in the actual Application Data containers of the SSL TCP stream, as
shown in Figure 2.
Figure 2
Based on this, we can infer how much data travels between the browser/client and the
server/Google Maps. We have to take into account that SSL might incorporate padding, so
it probably will never be a one-to-one mapping, but we are at least able to generate a flow
for a specific connection akin to this:
HTTP Request/Response Pairs (in bytes)
800 – 13891 818 – 23910
820 – 8920 800 – 6533
The response sizes correspond roughly to the PNG image sizes, so now we have to
convert these image sizes back to (x,y,z) coordinates. First we need to create a profile that
contains a mapping of satellite tile image sized to (x,y,z) coordinates.
Profiling Google Maps
To build the profile, we used the tool GmapCatcher1, an offline maps viewer with support for
Google Maps that catches the downloaded data in $(HOME)/.googlemaps/sat_tiles. We
used the gmaps-profile tool to convert all the downloaded images and their respective
(x,y,z) coordinates to a simple binary database, which looked something like:
1
http://code.google.com/p/gmapcatcher/
Copyright ©2011 by IOActive, Incorporated. All Rights Reserved. [2]SSL Traffic Analysis with GMaps-Trafficker
Image Size Coordinate List
12358 (1,2,3); (81,3,12); (144,45,8); …
19771 (43,66,2); (12,55,3); …
9013 (64,22,4); …
Traffic Analysis on Google Maps
Now we put the pieces together: we can identify individual request/response pairs and map
those response sizes back to a list of possible coordinates, but there are several problems:
• It's not really possible to create a database of all Google Maps tiles since you would
need several pentabytes of storage.
• If the profile data contains too many entries, the number of matching coordinates will
become too large.
• If the user has enabled the overlay images, two images are downloaded for each
(x,y,z) location; we need to differentiate between those two request types.
The last issue can be resolved; if you map the HTTP request sizes on a histogram, here's
what you get:
Figure 3
The first bump represents all the HTTP requests for the overlay images and the second
bump represents the HTTP requests for the satellite tiles. The difference is in the length of
the URL, although we could probably create a mapping based on response sizes, which
would be less reliable because the overlay images will, in general, be much smaller than
Copyright ©2011 by IOActive, Incorporated. All Rights Reserved. [3]SSL Traffic Analysis with GMaps-Trafficker
the satellite tiles. All the other bumps represent Google Maps data being loaded such as
the JavaScript APIs.
Based on this histogram, we can monitor a connection, create the histogram, and then
determine (after a certain amount of time) which requests likely correspond to actual
satellite images. All other requests are then ignored. If we continue to look at those
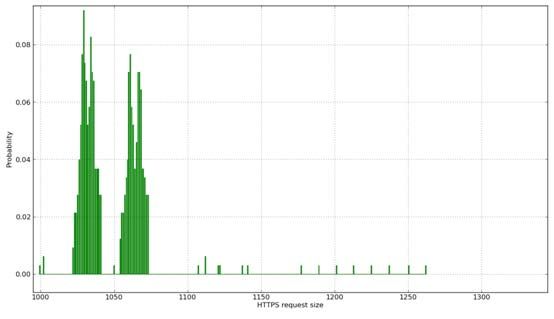
remaining HTTP response sizes, the image sizes of the satellite tiles are distributed roughly
according to the following graph.
Figure 4
If you get small images (roughly 1 kB), you'll have a lot more coordinates to search than if
you get big images. Of course, this is obvious since the larger images contain more
information (a mountain range and woods and a lake) than a simple satellite tile of the
middle of the ocean (of which there are many, indistinguishable from one another). So, for a
given time frame we have an enormous list of possible coordinates that we need to reduce
as quickly as possible, which goes like this:
For each zoomlevel z:
• Generate a hashmap index on x and put the (x,y) values in it.
• Generate a hashmap index on y and put the (x,y) values in it.
• Search for straight line segments as follows:
° For each x in the hashmap index on x look for adjacent y values.
° For each x in the hashmap index on x look for adjacent y values.
• Search for a combination of line segments that comprise an entire rectangle.
• Return the list of rectangles for zoomlevel z.
Copyright ©2011 by IOActive, Incorporated. All Rights Reserved. [4]SSL Traffic Analysis with GMaps-Trafficker
By using this approach, we eliminate all the coordinates that are placed somewhere
arbitrary and have no relationship to the other requests that occurred in that time frame.
Since the algorithm is somewhat difficult to describe, the following plot shows the analysis
of a certain time for a certain zoomlevel with all the (x,y) values.
Figure 5
If you look closely, the actual matches occur only at those places were actual rectangles
are being formed. If the browser's view window comprises eight tiles, we will get matches
for rectangles of at least eight tiles in size (in practice the rectangles will be bigger since
Google Maps loads hidden tiles on the edges of the viewport to make smooth scrolling.
Based on the above approach, we can reliably identify a complete zoom and get a bunch of
coordinates back for the rectangle. We can then convert these coordinates to latitude-
longitude pairs and even use reverse geocoding (not implemented yet) to convert these
pairs back to human-readable names. As a result, instead of 48,51; 2,21 we will get Paris,
France.
Copyright ©2011 by IOActive, Incorporated. All Rights Reserved. [5]SSL Traffic Analysis with GMaps-Trafficker Contact IOActive, Inc. Global Headquarters: 701 5th Avenue, Suite 6850, Seattle, WA 98104 Toll free: (866) 760-0222 Office: (206) 784-4313 Fax: (206) 784-4367 EMEA Headquarters: 110 Cannon Street, London EC4N 6AR Toll Free: +44 (0) 8081.012678 Direct: +44 (0) 2032.873421 Copyright ©2011 by IOActive, Incorporated. All Rights Reserved. [6]
You can also read