Changes over Time Country Briefing 2020: Thailand (East Asia and the Pacific)
←
→
Page content transcription
If your browser does not render page correctly, please read the page content below
Thailand 2012 - 2015/16                                                   Changes Over Time Country Briefing July 2020

 Oxford Poverty and Human Development Initiative (OPHI).
 Oxford Department of International Development
 Queen Elizabeth House, University of Oxford
 www.ophi.org.uk

Changes over Time Country Briefing 2020: Thailand (East Asia and the
Pacific)
This briefing describes trends in multidimensional poverty for Thailand between 2012 and 2015/16 using a
harmonised version of the global Multidimensional Poverty Index (MPI). For an explanation of the
methodology and detailed description of the harmonisation process for Thailand, see OPHI MPI
Methodological Note 50 (Alkire, Kovesdi et al 2020). For the results of the global MPI 2020 for Thailand
using the latest available data, please see the relevant global MPI 2020 country briefing.

The global MPI

The global MPI was launched in 2010 in collaboration with UNDP to measure acute multidimensional
poverty across the developing world. The MPI captures deprivation in three non-monetary aspects of human
life – health, education and living standards – reflected in the three dimensions and 10 indicators of the index.
All indicators in a dimension are assigned equal weights (1/6 for health and education, and 1/18 for living
standards indicators) and each dimension is weighted equally, receiving a third of the full weight. A person is
classified as multidimensionally poor if he or she is deprived in one third (33.33%) or more of the weighted
indicators. For a detailed methodology and description of the global MPI, see Alkire, Kanagaratnam and
Suppa (2020).

Figure 1. Structure of the global MPI
The MPI reflects both the incidence or headcount ratio (H) of poverty – the percentage of the population
who are multidimensionally poor – and the average intensity (A) of their poverty – the average share of
(weighted) deprivations in which poor people are deprived. The MPI value is calculated by multiplying the
incidence of poverty by the average share of deprivations (H x A).
Changes in Multidimensional Poverty over Time
This briefing tracks changes between harmonised versions of the global MPI. The harmonisation process
guarantees rigorous comparisons of changes in MPI and its associated statistics over time. We signify that
they are harmonised as MPI(T). Harmonisation produces strictly comparable MPI(T) estimations within a
country, over time. In other words, trends are estimated using a revised version of the indicators in the global
MPI so that precisely the same information is used in both years. This alteration of the original global MPI
structure for comparability means that the figures presented in this briefing might differ from those published
in the 2020 or previous global MPIs.
Goal 1 of the Sustainable Development Goals proposes an end to poverty in all its forms everywhere, and
Target 1.2 sets an aim for countries to reduce at least by half the proportion of men, women and children of
all ages living in poverty in all its dimensions according to national definitions by 2030. Tracking this target
requires over-time comparisons, like those we present here.
The ten indicators are closely aligned with the SDGs, and analysing trends in the harmonised global MPI
enables a close assessment of the progress made by each country, both in terms of reducing levels of
multidimensional poverty and improving specific SDG areas such as health or education. For further
information on how countries and datasets were selected, and for country-specific methodological
considerations, please see OPHI MPI Methodological Note 50.
National trends
Table 1 shows the levels and changes in MPI(T) values, incidence and intensity of poverty between 2012 and
2015/16 for Thailand. This gives an overall picture of multidimensional poverty in the country and an
indication of the speed of poverty reduction. The absolute reduction in poverty is calculated by subtracting one
measure of poverty from another and the annualised absolute change is this change divided by the number of
years between surveys. Meanwhile, the relative reduction in poverty is calculated as the difference in levels
across the two periods as a percentage of the initial period. The annualised relative change is the compound rate
of reduction per year between the two years.
Table 1. MPI(T), poverty headcount ratio (H) and average intensity (A) for Thailand
2012 2015/16 Annualised Annualised
absolute relative change
change
MPI(T) 0.005 0.003 -0.001 * -11.2%
H 1.4% 0.9% -0.2% ** -13.0%
A 37.3% 40.0% 0.8% * 2.0%
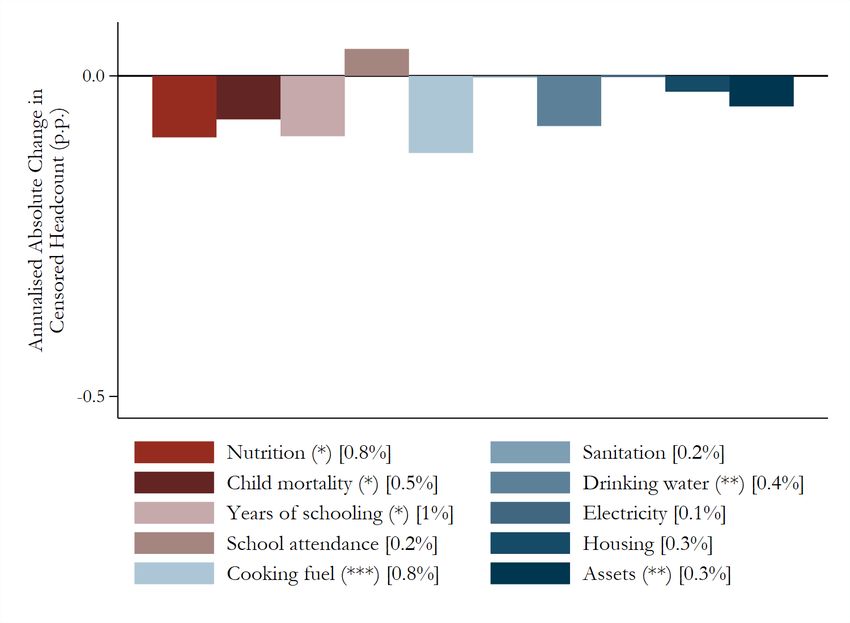
An advantage of the global MPI is that results can be broken down by indicators to provide a detailed picture
of deprivations by showing the interlinkages of deprivations in poor people’s lives. Censored headcount ratios arethe percentage of the population who are multidimensionally poor and deprived in a given indicator, and Figure 2 below presents the absolute change in the censored headcount ratios for Thailand between 2012 and 2015/16. Statistical significance of the difference is denoted by * at 90%, ** at 95% and *** at 99% confidence level. The number in squared brackets is the censored headcount ratio in the starting year. Figure 2. Changes in censored headcount ratios (absolute) between 2012 and 2015/16 Disaggregating the MPI – trends by region, area and age groups Eradicating poverty in all its forms is the main goal outlined in the SDGs. However, national level results can often mask inequalities in poverty across subgroups of the population and geographical areas of a country. Recognising the importance of such inequalities, the 2030 Sustainable Development Agenda pledged to ensure ‘no one will be left behind’ in the process of poverty reduction. Therefore in addition to changes at the national level, trends in the harmonised global MPI(T) can shine a light on the inequalities in poverty reduction by presenting disaggregated results at the area and subnational level, and for different age groups. This enables an assessment of whether poverty reduction in a country is pro-poor – with the poorest regions or groups having the fastest reduction, therefore reducing inequality among the poor. Contrastingly, if poverty reduces faster among the less poor regions or groups, those with the highest level of poverty fall further behind, hindering efforts to narrow the gap in poverty levels across the population. For some countries, such as Thailand, a subnational analysis is not possible. This is because (i) the sample is not representative at the subnational level; or (ii) the national MPI value is very low; or (iii) the final number of observations used to estimate the MPI (the retained sample) was below 85% of the total observations in the dataset; or (iv) comparability is compromised due to having different regional definitions in different
survey years. For further information on individual countries with missing subnational analyses, please refer
to the individual country information in OPHI MPI Methodological Note 50 (Alkire, Kovesdi et al. 2020).

It is also useful to assess trends among age groups and whether poverty reduced among both children and
adults. Figure 3 below has the same horizontal and vertical axis – with MPI(T) and absolute reduction rate –
and presents results for four age groups: 0-9, 10-17, 18-59, and 60+.

Figure 3. Absolute reduction in MPI(T) among age groups between 2012 and 2015/16

The MPI(T) also shows the composition of poverty in a given country or area which can inform governments
and help design policies and programmes targeting the deprivations that are contributing the most to poverty.

The figure below (Fig. 4) shows the weighted contribution of the ten indicators to the MPI at the national
level and in urban and rural areas for each of the two time points. The height of the bar reflects the value of
MPI(T), while the contribution of each indicator is shown by the height of the relevant coloured stripe.
Figure 4. Contribution of each indicator to MPI(T) values in 2012 and 2015/16 at the national and urban-rural level

Further information

In addition to the trends analysis presented in this brief, all results for Thailand can be accessed in Table 6 on
the OPHI website. Table 6 contains all results for the countries included in the Changes over Time 2020
release. This includes results for each country at the national level and for the three disaggregations included
in the global MPI(T): area level, subnational and age group. Access Table 6 at
https://ophi.org.uk/multidimensional-poverty-index/data-tables-do-files/.

An analysis of trends in 80 countries including a comparison of monetary and multidimensional poverty
trajectories is available in Research in Progress 57a (Alkire, Kovesdi et al 2020), at
https://ophi.org.uk/publications/ophi-research-in-progress.

A detailed description of the methodology including country specific harmonisation decisions is available in
MPI Methodological Note 50 at https://ophi.org.uk/publications/mpi-methodological-notes.

Country briefing files for all 80 countries, and the 107 countries included in the global MPI, are available at
https://ophi.org.uk/multidimensional-poverty-index/mpi-country-briefings.

For a list of Frequently Asked Questions about trends in the global MPI and the global MPI 2020, see
https://ophi.org.uk/gmpi-2020-faq/

The latest global MPI report ‘Charting pathways out of multidimensional poverty: achieving the SDGs’,
featuring an analysis of trends in the global MPI is available at:
https://ophi.org.uk/publications/special-publications/.
You can also read