A CFD Analysis of Smoke Movement in Steel Industry Sheds
←
→
Page content transcription
If your browser does not render page correctly, please read the page content below
IOSR Journal of Mechanical and Civil Engineering (IOSR-JMCE)
e-ISSN: 2278-1684, p-ISSN: 2320-334X
PP 79-83
www.iosrjournals.org
    A CFD Analysis of Smoke Movement in Steel Industry Sheds
           Sandeep V. Lutade1, Krunal Mudafale2, Ranjan Kishore Mallick3
         1, 2
                Mechanical Dept. Dr.Babasaheb Ambedkar College of Engineering and Research, Nagpur
                                  3
                                    Mechanical Dept. Pursing PhD. VNIT, Nagpur

 ABSTRACT: The problem has taken from a steel making industry which is situated at Wardha, Nagpur. There
is a furnace in the shed where smoke is generated and some smoke is passed through the duct and removed by
the blower, situated at the base of the chimney but remaining smoke is moving inside the furnace. Due to this,
the workers in the shed were not working properly or even they could not see towards each other. A model
similarly with the physical shed has designed by work bench. This model mainly covers the analysis of smoke
movement, distribution of shed temperature, pressure, and calculation of mass flow and capacity of blower.
Results predicted by the model are compared with the experimental results by NPFA charts.

Keywords: Ansys Fluent, CFD, NPFA chart, Smoke movement.

                                            I. INTRODUCTION
         Smoke may be simply defined as a cloud of well mixed gases and unburnt solid particles which are a
product of combustion. Smoke generation is greatly influenced by the amount and type of fuel and the air
available for combustion.
         Smoke control techniques are used to manage smoke movement in buildings and to direct smoke away
from escape routes. Smoke control can involve passive and/ or active means to modify and direct the passage of
smoke to minimize its harmful effects on occupants and property.
The amount of smoke generated can be estimated by NFPA 92B as
   m =0.071K (2/3) Q (1/3) Z (5/3) + 0.0018Qr
Where m= mass flow rate of smoke at height z, kg/sec
                K=wall factor
                Q=heat release of fire, kW
                Z=height of smoke
Qr =convective heat release rate of fire, kw =0.7Q

                                     II. DEFINATION OF PROBLEM.
         The problem has taken from a steel making industry which is situated at Wardha, Nagpur. There is a
furnace in the shed where smoke is generated and some smoke is passed through the duct and removed by the
blower, situated at the base of the chimney but remaining smoke is moving inside the furnace. As a result after
few hours, there are huge amount of smokes, moving inside the shed. Due to this, the workers in the shed were
not working properly or even they could not see towards each other.
Now my aim is to modify and direct the passage of smoke to minimize its harmful effects on occupants and
property. Before analyzing, I have assumed various parameters such as
Geometry has considered in 2dimensional.
The furnace is located at the middle of the shed
Smoke distributions has been considered to be 2dimensional in nature
There is no effect of wind on the shed.

                                     III. PROBLEM FORMULATION
       The problem is formulated in two parts. In the first part, the smoke movement in the shed was analyzed
by CFD approach. In the second part of problem formulation, the capacity of induced blower is calculated.

                                           IV. CFD MODELLING
4.1 Introduction:
Based on control volume method, 2-D analysis of smoke movement inside the shed is done on fluent software
4.2 Geometry part:
The geometry of the model is done using workbench.
Specification of shed-

International Conference on Advances in Engineering & Technology – 2014 (ICAET-2014) 79 | Page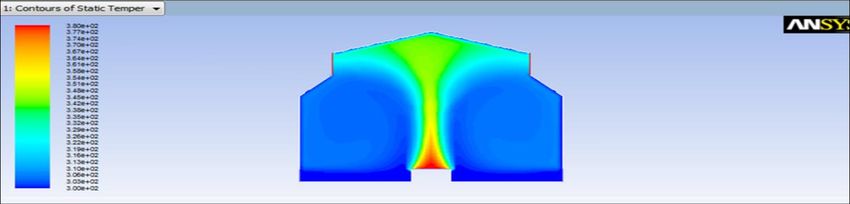
IOSR Journal of Mechanical and Civil Engineering (IOSR-JMCE)
e-ISSN: 2278-1684, p-ISSN: 2320-334X
PP 79-83
www.iosrjournals.org
Width (B):40m
Height (H):30m

                               Figure4.1 Geometry of the model in workbench
4.3Meshing part
The geometry is modeled in workbench and the mesh is fine meshed to cope-up the thermal and velocity
boundary layer formation as shown in figure.

                                           Figure4.2Mesh of geometry

Nodes-2157        Elements-2066

4.4 Fluent part
A.PROBLEM SETUP
1. General      1. a. solver (i) Type-pressured based
                             (ii) Velocity formation-absolute
                             (iii) Time-steady
                              (iv) 2d space-planner
                1. b. Model       -k-epsilon
                                   -Standard
                                    -Standard Wall Functions-
                                    -Model constants table
Table4.1Model constants table
                                 Cmu                          .09
                                C1-Epsilon                     1.44
                                C2-Epsilon                     1.92
                                TKE Prandtl Number             1
                                TDR Prandtl Number             1.3
                                Energy                         0.85
                                Wall                           0.85
B.SOLUTION
1. a. Solution method (i) Scheme-Simple
 (ii)Pressure-standard
(iii) Momentum-2nd order
(IV) energy- 2nd order
b. Solution control-          Relaxation factors are taken to be default values
Table4.2Relaxation factors table
                                   Pressure                                   0.3
                                   Density                                    1
                                   Body force                                 1
                                   Momentum                                   0.7

International Conference on Advances in Engineering & Technology – 2014 (ICAET-2014) 80 | Page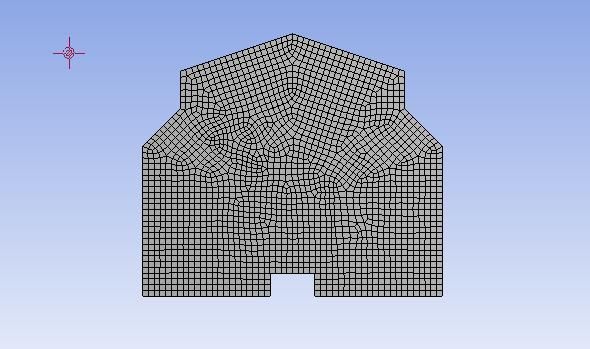
IOSR Journal of Mechanical and Civil Engineering (IOSR-JMCE)
e-ISSN: 2278-1684, p-ISSN: 2320-334X
PP 79-83
www.iosrjournals.org
Turbulent kinetic energy 0.8
Turbulent dissipation rate 0.8
Turbulent viscosity 1
Energy 1
V. RESULTS
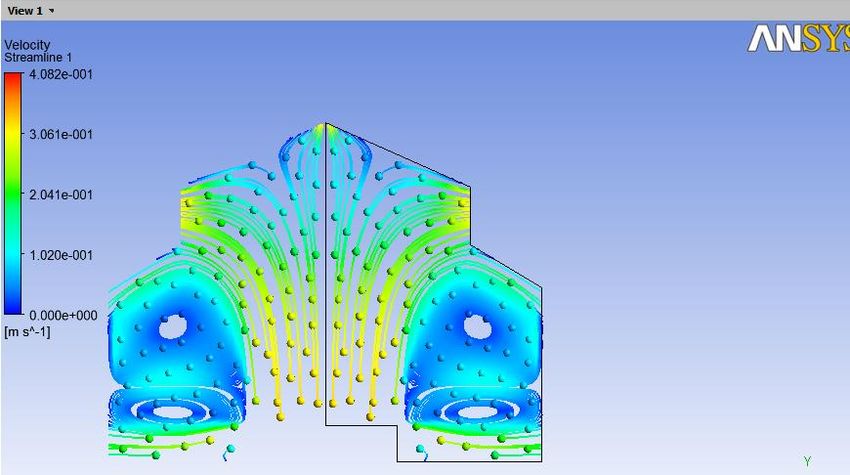
5.1. Initial Smoke flow simulation
In this section, the initial smoke flow simulation has analyzed. The initial velocity and temperature of
smoke is taken as 1m/s and 400K respectively. The simulation shows that the smoke generated at the periphery
of furnace are moving inside the shed.
Figure5.1-velocity streamlines at outlet duct pressure 01 atmosphere
5.2. Temperature profile
The temperature is maximum at the bottom of the middle of the shed because the furnace is located at the
bottom of the shed. The profile shows that temperature also decreases from bottom to top of the shed as shown
below figure.
Figure5.2Temperature profile at outlet duct pressure -0.0205 atmosphere
5.3Table-Comparison of temperature with CFD and NFPA CHART
S.No. Vertical Position Temperature(K) Experimental (K) %of error
from furnace(m) (CFD) (NFPA chart )
1 2 380 373 1.84
2 4 378 363 4.76
3 6 350 353 0.85
4 8 330 348 5.45
5 10 328 338 3.04
6 12 320 333 4.06
7 14 318 330 3.77
8 16 315 328 4.12
Table5.1 Comparison of temperature with CFD and NFPA Chart
5.4Validation of temperature
International Conference on Advances in Engineering & Technology – 2014 (ICAET-2014) 81 | PageIOSR Journal of Mechanical and Civil Engineering (IOSR-JMCE)
e-ISSN: 2278-1684, p-ISSN: 2320-334X
PP 79-83
www.iosrjournals.org
The temperature is maximum at the bottom of the middle of the shed and it also decreases from bottom
to top of the shed. The graph between temperatures vs. position has drawn (denoted as blue curve) from CFD
data and it almost matches with national fire protection association (nfpa) chart.
Figure5.4-validation by temperature
5.4 CALCULATION OF MASS FLOW BY NFPA
The amount of smoke generated can be estimated by NFPA 92B as
m =0.071K (2/3) Q (1/3) Z (5/3) + 0.0018Qr
Where m= mass flow rate of smoke at height z, kg/sec
K=wall factor
Q=heat release of fire, kW
Z=height of smoke
Qr=convective heat release rate of fire, kw=0.7Q
m =0.071*1*2000^(1/)*28^(5/3) +0.0018*0.7*2000=230kg/sec
5.5 Calculation of capacity of blower
INLET OF BLOWER
Static head (Ps) = -2050Pa= -207mm of H2O
Velocity head (Pv)=ρv2/2g=1.2*402/2*9.81=96mm of H2O
Friction head=f L /m*(v/4.04)2=0.005*35/.25* (40/4.04)2= -68.66 mm of H2O
Total inlet head (H1) = -207+96-68.66=-197.66 mm of H2O
OUTLET OF BLOWER
H2=mm of H2O of N.D. IN CHIMENEY=176.5H/Ta
=176.5*30/300= 17.65 mm of H2O
Total head=H=17.65-(-197.66)=197.31mm of H2O
Discharge=Q=A*V=.7*40=28m3/s
Total power=9.81*Q*H/1000=9.81*28*197.31/1000=54Kw
Considering ŋmotor= 80% and ŋblower = 50%,
TOTAL POWER= 54/0.5*0.8=136KW
But available capacity of blower in market Q=150m3/h-150000m3/h,
H=100mm-1500mm of H2O, power=1HP-50HP (37KW)
Total no of blowers=136/37=3.66=04
CONCUSION
The smoke flow simulation inside the shed is minimum at outlet duct pressure -2050pascal.
The capacity of each blower is 37 KW.
The no of blowers is recommended to be 04.
All the outlet ducts are located in same line along z axis at a distance of 25m from floor.
REFERENCES
-NFPA 92B, Guide for smoke management systems in malls, atria and large areas, National Fire.
-J.H. Klote and J. Milke, Design of smoke management systems, ASHRAE Publications 90022 (1992).
Protection Association, Quincy, MA, USA (1995).Fire engineering guidelines, 1st edition, Fire Codes Reform Centre Ltd., Sydney, NSW,
Australia(1996).
-CIBSE Guide E, Fire engineering, The Chartered Institution of Building Services Engineers, London,UK (1997). .
International Conference on Advances in Engineering & Technology – 2014 (ICAET-2014) 82 | PageIOSR Journal of Mechanical and Civil Engineering (IOSR-JMCE) e-ISSN: 2278-1684, p-ISSN: 2320-334X PP 79-83 www.iosrjournals.org -GobeauN,Ledin H. S.,Lea C. J. (2003) ,Guidance of HSE inspectors-Smoke movement in a complex Enclosures spaces: assessment of computational fluid dynamics. -Gobeau N.,Ledin H. S.,Lea C J , Iving M.I, Allen J T, Bettis R J (2004)Evaluation of computational fluid dynamics for predication of smoke movement in a complex Enclosures space-HSE report. -L.Yi,R.Huo,Y.Z.Li,andR.Feng(2004),Numerical studies of atrium smoke movement induced by a shop fire, international journals on engineering performance-based fire code,V-5, Nov4,p163-169. International Conference on Advances in Engineering & Technology – 2014 (ICAET-2014) 83 | Page
You can also read


