Supplement of No nitrogen fixation in the Bay of Bengal?
←
→
Page content transcription
If your browser does not render page correctly, please read the page content below
Supplement of Biogeosciences, 17, 851–864, 2020
https://doi.org/10.5194/bg-17-851-2020-supplement
© Author(s) 2020. This work is distributed under
the Creative Commons Attribution 4.0 License.

Supplement of
No nitrogen fixation in the Bay of Bengal?
C. R. Löscher et al.

Correspondence to: Carolin R. Löscher (cloescher@biology.sdu.dk)

The copyright of individual parts of the supplement might differ from the CC BY 4.0 License.
1   Model experiment

 2   The model framework is based on Canfield’s 5-box model (Boyle et al. 2013; Canfield 2006), using available
 3   measurements for the BoB from our cruise and other literature (Tab. M1, the complete code will be released
 4   on Pangaea). The model is classically based on the identification of the limiting nutrient for euphotic primary
 5   production under Redfield conditions. Primary production provides the basis for determination of export
 6   fluxes under consideration of respiration first using oxygen, followed by nitrate and sulfate according to the
 7   following stoichiometry:

 8                                            C 6 H 12 O 6 + 6O 2 -> 6CO 2 + 6H 2 O

 9                               2.5 C 6 H 12 O 6 + 12NO 3 - -> 6N 2 + 15CO 2 + 12OH- + 9H 2 O

10                                    CH 3 COO- + SO 4 2-+ H 2 O -> H 2 S + 2HCO 3 - + OH-

11   Export production is estimated as the sum of organic carbon respiration (R) of the three above mentioned
12   processes:

13                                       EP = R aerobic + R denitrification + R sulfate_reduction

14   For nitrate-based primary production, i.e. if nitrate is available above Redfield conditions, primary and
15   export production directly depend on upwelling of bioavailable nitrogen. Surface N 2 fixation is based on
16   Redfield stoichiometry and on Fe availability (Fe > 0). If

17                                                        N ox - r N:P P < 0

18   is true, export production is proportional to phosphate upwelling to the euphotic zone.

19   The model was further modified to explore OMZ N 2 fixation, which we suggest adding a source of reduced N
20   (N R ) to the OMZ. This pool of N R would upon mixing or upwelling to the oxic surface promote nitrification
21   and primary production.

22   OMZ N 2 fixation has been shown not to be limited by Redfield constraints Redfield stoichiometry as
23   suggested by Bombar, Paerl, and Riemann (2016). This leads to a modification of the previous OMZ model
24   (Boyle et al, 2013) with the Redfield control of N 2 fixation being replaced by a phosphorous only control with
25   P > 0 constantly allowing for N 2 fixation and export production scaling with phosphate and N ox + N R upwelling.

26

27
28   Tables

29   Tab M1: Concentrations used in the model experiment, data taken from Bristow et al. (2017), Grand et al.
30   (2015) and (Chinni et al. 2019)

31

32

33   Table S1: OTU counts of primary producers from a metagenome from station #4, 84m.

34
35   Table S2: POC and PON distribution at stations 1 (17.9970°N, 88.9968°E), 4 (16.9828°N, 89.2063°E) and 5
36   (17.2075°N, 89.4282°E).

37

38

39   Table S3: nifH qPCR quantification [copies L-1], clusters which did were detectable by PCR but not
40   quantifiable (below the detection limit of 4 copies L-1) are not shown.

41
42
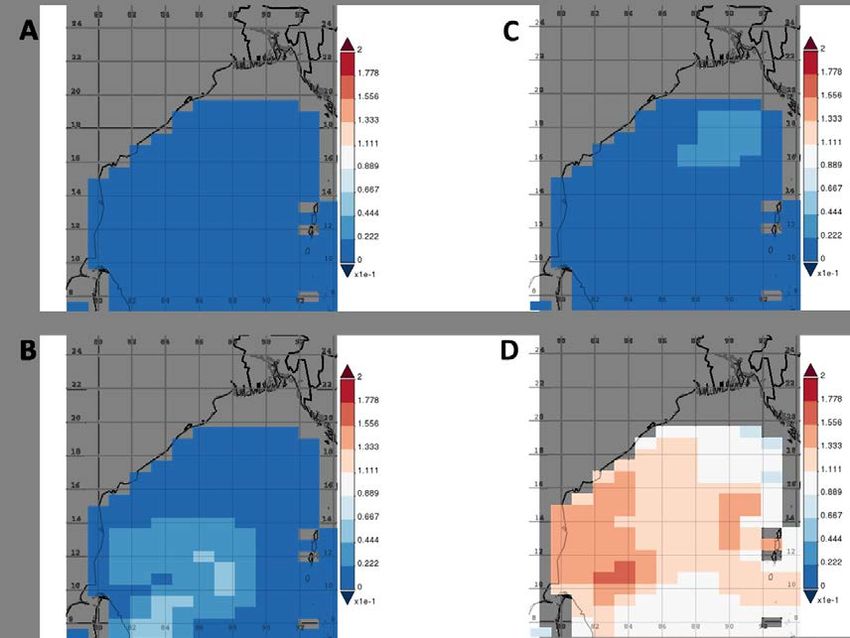
43   Figures

44

45   Figure S1: Phytoplankton distribution in the BoB during the time of the cruise: (A) diatoms, (B) chlorophytes,
46   (C) coccolithophores, and (D) cyanobacteria in mg m-3. Data obtained from a combination of the Sea-viewing
47   Wide Field of view Sensor (SeaWiFS), the Moderate Resolution Imaging Spectroradiometer (MODIS-Aqua),
48   and the Visible Infrared Imaging Radiometer Suite (VIIRS) satellite product as available from
49   https://giovanni.gsfc.nasa.gov have been averaged from 15 Jan to 15 Feb, 2019. The combination of those
50   sensors allows for covering a range of different wavelengths useful to identify different phytoplankton clades.
51   The maps have been generated using the NASA Ocean Biogeochemical Model (NOBM, Gregg and Casey
52   (2007)) using the most recent version of NASA ocean color data product (R2014), which represents
53   circulation/biogeochemical/radiative processes in a 2/3° latitude spatial resolution as described in Gregg,
54   Rousseaux, and Franz (2017). NOBM is designed to represent open ocean areas, with water depths greater
55   than 200 m. It contains four phytoplankton groups, diatoms, chlorophytes, cyanobacteria, and
56   coccolithophores, to represent diversity in the global oceans. Total chlorophyll is the sum of the
57   phytoplankton groups.
58

59   Figure S2: Time-averaged (15 Jan to 15 Feb, 2019) POC distribution as monitored via MODIS-Aqua
60   (https://giovanni.gsfc.nasa.gov) on an 8-daily basis, with a 4km resolution, POC concentrations in mg m-3,
61   concentrations in the cruise area were between 7.7 and 12.9 mg m-3 and are consistent with our in-situ
62   measurements.

63

64   Fig. S3: Both, (A) δ15N-NO 3 - (data from Bristow et al., 2017) and (B) δ 15N-PON show slightly lighter isotope
65   signatures in the upper 100 m of the water column (samples were collected between 3 and 2300 m water
66   depth), however, this signal does not clearly indicate N 2 fixation.
67

68   References

69   Bombar, Deniz, Ryan W. Paerl, and Lasse Riemann. 2016. 'Marine Non-Cyanobacterial Diazotrophs: Moving
70           beyond Molecular Detection', Trends in Microbiology, 24: 916-27.
71   Boyle, R. A., J. R. Clark, S. W. Poulton, G. Shields-Zhou, D. E. Canfield, and T. M. Lenton. 2013. 'Nitrogen
72           cycle feedbacks as a control on euxinia in the mid-Proterozoic ocean', Nature Communications, 4:
73           1533.
74   Bristow, L. A., C. M. Callbeck, M. Larsen, M. A. Altabet, J. Dekaezemacker, M. Forth, M. Gauns, R. N. Glud,
75           M. M. M. Kuypers, G. Lavik, J. Milucka, S. W. A. Naqvi, A. Pratihary, N. P. Revsbech, B. Thamdrup, A.
76           H. Treusch, and D. E. Canfield. 2017. 'N2 production rates limited by nitrite availability in the Bay of
77           Bengal oxygen minimum zone', Nature Geosci, 10: 24-29.
78   Canfield, D. E. 2006. 'Models of oxic respiration, denitrification and sulfate reduction in zones of coastal
79           upwelling', Geochimica et Cosmochimica Acta, 70: 5753-65.
80   Chinni, Venkatesh, Sunil Kumar Singh, Ravi Bhushan, R. Rengarajan, and V. V. S. S. Sarma. 2019. 'Spatial
81           variability in dissolved iron concentrations in the marginal and open waters of the Indian Ocean',
82           Marine Chemistry, 208: 11-28.
83   Grand, Maxime M., Christopher I. Measures, Mariko Hatta, William T. Hiscock, William M. Landing, Peter L.
84           Morton, Clifton S. Buck, Pamela M. Barrett, and Joseph A. Resing. 2015. 'Dissolved Fe and Al in the
85           upper 1000 m of the eastern Indian Ocean: A high-resolution transect along 95°E from the Antarctic
86           margin to the Bay of Bengal', Global Biogeochemical Cycles, 29: 375-96.
87   Gregg, W. W., C. S. Rousseaux, and B. A. Franz. 2017. 'Global trends in ocean phytoplankton: a new
88           assessment using revised ocean colour data', Remote Sens Lett, 8: 1102-11.
89   Gregg, Watson W, and Nancy W %J Deep Sea Research Part II: Topical Studies in Oceanography Casey.
90           2007. 'Modeling coccolithophores in the global oceans', 54: 447-77.

91
You can also read