LNG Market Fundamentals - October 2019

Page created by Sue Obrien
 
CONTINUE READING
LNG Market Fundamentals - October 2019
LNG Market Fundamentals

October 2019
LNG Market Fundamentals - October 2019
Cautionary statements
Forward-looking statements
The information in this presentation includes “forward-looking statements” within the meaning of         The forward-looking statements made in or in connection with this presentation speak only as of the
Section 27A of the Securities Act of 1933, as amended, and Section 21E of the Securities Exchange        date hereof. Although we may from time to time voluntarily update our prior forward-looking
Act of 1934, as amended. All statements other than statements of historical fact are forward-looking     statements, we disclaim any commitment to do so except as required by securities laws.
statements. The words “anticipate,” “assume,” “believe,” “budget,” “estimate,” “expect,”
“forecast,” “initial,” “intend,” “may,” “plan,” “potential,” “project,” “should,” “will,” “would,” and
similar expressions are intended to identify forward-looking statements. The forward-looking
statements in this presentation relate to, among other things, gas resources, production and costs,
infrastructure needs and costs, LNG export and pipeline capacity, LNG bunkering, LNG prices, future
demand and supply affecting LNG, and general energy markets and other aspects of our business
                                                                                                         Reserves and resources
and our prospects and those of other industry participants.                                              Estimates of non-proved reserves and resources are based on more limited information, and are
Our forward-looking statements are based on assumptions and analyses made by us in light of our          subject to significantly greater risk of not being produced, than are estimates of proved reserves.
experience and our perception of historical trends, current conditions, expected future
developments, and other factors that we believe are appropriate under the circumstances. These
statements are subject to numerous known and unknown risks and uncertainties, which may cause
actual results to be materially different from any future results or performance expressed or implied
by the forward-looking statements. These risks and uncertainties include those described in the “Risk
Factors” section of our Annual Report on Form 10-K for the fiscal year ended December 31, 2018 and
our other filings with the Securities and Exchange Commission, which are incorporated by reference
in this presentation. Many of the forward-looking statements in this presentation relate to events or
developments anticipated to occur numerous years in the future, which increases the likelihood that
actual results will differ materially from those indicated in such forward-looking statements.

Disclaimer
LNG Market Fundamentals - October 2019
Global LNG capacity call: ~100-250 mtpa
mtpa
    800                                                                                                                                                                                                                Capacity required(1)
                                 9.3% p.a. growth rate                                                                                                                                                          9.3%(2)
    700
                                                                                                                                                                                                                                            ~250 mtpa
    600
                                                                                                                                                                                                               5.0%(3)
    500                                                                                                                                                                                                                                     ~100 mtpa

    400

    300                                                                                                                                                                                                                   Possible FID projects(6)
                                                                                                                                                                                                                          Likely FID projects(5)
    200
                                                                                                                                                                                                                          Under construction(4)
    100
                                                                                                                                                                                                                          In operation
        -
        2015                 2016                2017               2018                2019                2020                  2021         2022                2023               2024                2025

    Sources:   Wood Mackenzie, Bernstein, Morgan Stanley and Tellurian Research.                                                                  Freeport T1-3, PetronasFLNG 2, Portovaya, Prelude, Sengkang, Tangguh, Vysotsk and LNG Canada.
    Notes:     (1) Assumes 86.5% utilization rate.                                                                                   (5) Assumes ~40 mtpa of likely FID projects, including: Artic LNG T1-3, Mozambique Area 4 and new Qatar T1-3.
               (2) Assuming sustained 2015-2018 demand growth rate of ~9.3% p.a. post-2019.                                          (6) Assumes ~25 mtpa of possible FID projects, including: Cameron T4-T5, Freeport T4, PNG T3, Corpus Christi LNG Stage 3 and
               (3) Assumes 5.0% p.a. demand growth rate post-2019.                                                                       Papua LNG T1-T2.
               (4) Assumes ~80 mtpa of projects under construction, including: Cameron T1-3, Calcasieu Pass, Elba Island T1-10,

3
LNG Market Fundamentals - October 2019
Global LNG demand pull
    Key drivers

                                                                           800                                                                                           Capacity required(1)
    China
                                                                                                                                                                    9.3%(2)
                                                                           700
                                                                                                                                                                                 ~250 mtpa
                                                                                               9.3% p.a. growth rate
                                                                           600
                                                                                                                                                                    5%(3)
    India                                                                  500
                                                                                                                                             Under construction                  ~100 mtpa
                                                                           400
                                                                                                                                                    In operation
                                                                           300
    Europe
                                                                           200

                                                                           100
    New
    markets                                                                     0
                                                                                            2015   2016   2017   2018   2019   2020   2021   2022   2023   2024   2025
    Sources: Wood Mackenzie, Tellurian Research.
    Notes: (1) Assumes 86.5% utilization rate.
             (2) Assuming sustained 2015-2018 demand growth rate of ~9.3% p.a. post-2019.
             (3) Assumes estimate of 5.0% p.a. demand growth rate post-2020.

4
LNG Market Fundamentals - October 2019
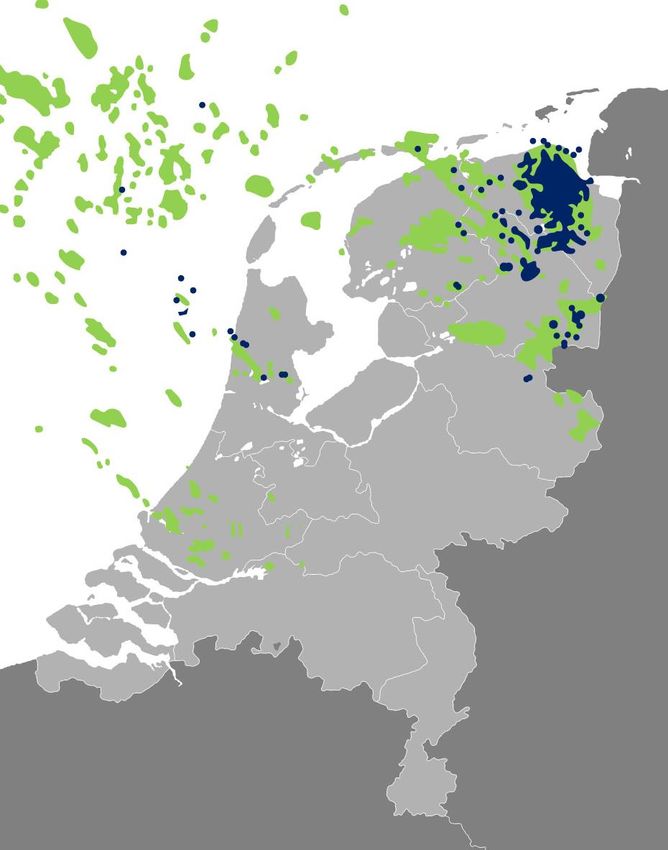
Emerging consumption: China and India
     Population and economic growth imply significant upside to gas consumption in China and India

                                                                                            Size indicates relative           Natural gas’ share of 2018 energy mix
    GDP/capita
                                                                                            volume of gas
     $80,000
                                                                                            consumed per capita in
                                                                                            2018 (mcf/capita)
     $70,000
                                                               United States
     $60,000                                                  87 mcf/capita

     $50,000

     $40,000                                                      European Union
                                                                   38 mcf/capita                                                                                        49%
     $30,000

                                                                                              China                                                         31%
     $20,000
                                                                                           7 mcf/capita                                        23%
                                           Argentina
     $10,000                             38 mcf/capita
                                                                                                    India              6%           7%
                                                                                                2 mmcf/capita
               $-
                          -                          500                           1,000         1,500      2,000     India       China         EU          U.S.      Argentina
                                                                  Population (millions)
    Sources: IHS Markit, SIA Energy, EIA, CIA World Factbook, BP Energy Outlook.

5
LNG Market Fundamentals - October 2019
Growing demand in China
    Economic growth and emerging environmental policy drives demand growth

    Chinese gas demand
    billion cubic meters per year
                                                                             510
                                             438
                                                                             120   LNG          4.5% CAGR
                                                                                                (2018-2030)
                                             108

                   277

                    74                                                             Domestic
                                                                             391   production   6.1% CAGR
                                                                                                (2018-2030)
                                             330                                   & pipeline
                   203
                                                                                   imports

                   2018                      2025                        2030
    Source: SIA.

6
LNG Market Fundamentals - October 2019
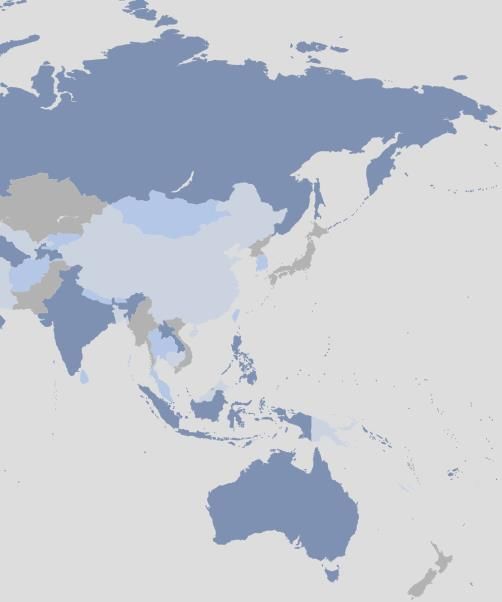
India gas demand requires significant LNG imports
    India natural gas demand – primary sources
    mtpa
              100                                                                    95
                                 Domestic production
                                                                             88
                                 Contracted LNG
                                                                     79
               80                Uncontracted LNG
                                                             70
                                                                             41
                                                             15      28              61
               60
                                                       48
                                  41                   7     23      15      12
               40
                                  8
                                                       19                            3
                                  14
               20
                                                             32      36      35      31
                                  19                   21

                 -
                                 2018               2020E   2025E   2030E   2035E   2040E

    Source:    Wood Mackenzie.

7
LNG required to offset Groningen declines
    Netherlands capping production from the Groningen field requires ~10 mtpa of LNG
                                                          bcm
                                                                                Groningen yearly production
                                                            54
                                                                                                                                         Forecast
                                   Netherlands

                                                                  42                                                 Mandated
                                                                                                                   production cap

                                                                         28      28
                                                                                       24
                                                                                              22

                                                                                                     15
                                                                                                            12      12     12
                                                                                                                                   8
                                                                                                                                          4      3

             Gas fields

                                                                                                                                         2024
                                                           2013

                                                                  2014

                                                                         2015

                                                                                2016

                                                                                       2017

                                                                                              2018

                                                                                                     2019

                                                                                                            2020

                                                                                                                    2021

                                                                                                                           2022

                                                                                                                                  2023

                                                                                                                                                2025
             Earthquakes

    Source: NAM, Energy Aspects.

8   Global LNG
Growing number of importers accessing LNG
    The number of LNG importing nations has grown by ~60% in the last 7 years

                                      33 total floating storage
                                       and regasification units
                                       (FSRUs) represent ~130
                                                                                                                                                  42
                                           mtpa of global                                                                                  40
                                     regasification capacity as                                                                     39
                                             of May 2019
                                                                                                                             34
                                                                                                                      30
                                                                                     29                                                           868
    Number of                                                                                                                              850
                                                                                                                                    830
    importing
                                                26                                                                           777
    countries                                                                                                         751
                                                                                   721
    Global regas
    capacity                                  668
    (mtpa)
                                             2012                                 2013                                2014   2015   2016   2017   2018

    Source: GIIGNL, IGU (2019), IHS Markit.
    Notes: Includes Lampung, Nusantara, and Tanjung Benoa (all in Indonesia) and Northeast Gateway (United States).

9
U.S. emerges as the world’s largest LNG exporter
     Based on firm capacity

                                                                                          30.6

                                                                       Triangle of low-
                                                                          cost supply

                                                                 102
                                                                                            77.8
                                                                                                   88.8
           Current capacity (mtpa)
            (producing and under
                construction)
     Source: Wood Mackenzie, Tellurian Research.
     Notes: Includes existing and under construction projects.

10
Plentiful, low-cost U.S. natural gas
     Production growth and resource base from selected U.S. unconventional basins                                                                            Resource
                                                                                                                                                              size, Tcf

                                                                                                                                                               Basin
                                                                                                                                                       Wellhead cost, $/mmBtu
                                                                                                                 411
                                                                                                                              Total U.S. lower-48 dry natural gas production
                                                                                                                       36.0
                                                                                                                              Bcf/d
                                                                                                          29.2                                    135             53      RBN(1)

                                                                         7.4
                                                    3.6      23
                                                  2018                 2025
                                                      Anadarko                                                                                                     17       EIA
                          74                           $0-$1.00                                           2018         2025
                                    16.9
                                                                                                          Marcellus-Utica
                9.6
                                                                                             112             < $1.00
                                                                                                                                                  99

              2018                 2025                    52                                                                     82

                                                                                      8.6          9.4
                      Permian                                          7.9
                       < $1.00                    4.9

                                                                                      2018         2025
                                                2018                 2025                                                        2018            2025          Production
                                                    Eagle Ford                          Haynesville
                                                                                                                                                                 growth
                                                    $0 - $1.50                            < $1.50
     Source: EIA 2019 Annual Energy Outlook, DrillingInfo, RBN, Tellurian analysis.
     Note: (1) RBN high case – extrapolated from 2024 to 2025 by Tellurian.

11
Looming challenge of U.S. gas oversupply
     U.S. natural gas must be exported

      Legend                                                                                                                                                                     2018-2025:
                  Operating/under construction LNG                                                                                                          +7

                  Future infrastructure required                                                                                                                                   +22    Bcf/d total gas supply growth(1)
       +X         Incremental gas supply by 2025 (bcf/d)
                                                                                                                                                                                   +12    Bcf/d excess gas supply(2)
                          +4
                                                                                                                                                                                   +100   mtpa LNG capacity required(3)

                                                                                   +1
                  +7

                                                                                                                                                                                  ~$150 - $225 billion(4) of investment
                                       +3                                                                                                                                       required to build 100-150 mtpa of LNG
                                                                                                                                                                                 and supportive pipeline infrastructure
                                                                                                                                                                                   to export excess U.S. gas supply

     Sources: DrillingInfo, EIA, Tellurian analysis.
     Note:    (1) Assumes $70/bbl oil price and $3/mmBtu Henry Hub price; incremental supply comes from Permian, Scoop/Stack, Haynesville, Eagle Ford, and Appalachia.
              (2) Assumes U.S. natural gas demand grows 0.6% p.a. and that the 7.4 bcf/d of LNG terminals under construction produce at a 90% utilization rate.
              (3) Assumes new LNG terminals produce at a 90% utilization rate.
              (4) Assumes new liquefaction capacity costs $1,000 per tonne plus an additional $70 billion of pipeline infrastructure to transport gas supply to the terminal.

12
U.S. must export ~30 bcf/d of LNG by 2025
 …including an additional ~20 bcf/d of LNG export capacity over firm capacity

 U.S. natural gas export requirements
                                                                                              29 bcf/d

                                                                                                                            ~20 bcf/d
                                                                                                                            additional U.S. LNG export capacity required(1)

                                                                                                                            $150 billion
                                                                                                                            investment required for >150 mtpa of additional LNG capacity(2)

                                                                                             Firm LNG
                               4 bcf/d                                                        export
                                                                                            capacity(3)

                                 2018                                                            2025E
     Source:   RBN, Tellurian analysis.                                                                                         (3) Includes 86 mtpa (11.5 bcf/d) of operational and under construction liquefaction export capacity.
     Notes:    (1) Assumes U.S. domestic gas demand grows at 0.6% p.a. and liquefaction capacity utilization rate of 90%.
               (2) Assumes $1,000 per tonne for liquefaction capacity.

13
Thank you
You can also read