Uranium Resources Production and Demand (the "Red Book") - Uranium supply and demand to 2035
←
→
Page content transcription
If your browser does not render page correctly, please read the page content below
Uranium Resources
   Production and Demand
      (the “Red Book”)

Uranium supply and demand to
           2035
            Robert Vance
           UNMP Consulting
           UNECE Training November 2018
“Red Book”
Recognized source for global resource
information
Longstanding OECD/NEA and IAEA
cooperation – first published in 1965 –
since 1990s published every 2 years
Relies principally on input from country
representatives nominated by
governments to the Uranium Group
Over 100 countries have contributed to
the publication over its history

                                           UNECE Training November 2018
Uranium Group history
Formed in the mid 1960s - OECD, European Nuclear Energy Agency
1991: former Eastern Block countries join
1996: International Atomic Energy Agency member states formally join; re-
organized as the Joint OECD-NEA / IAEA Uranium Group
Red Book series a history of resource and mine development, changing supply
and demand situation
Recent meetings in U producing countries: 2000 Brazil; 2002 China; 2004
Czech Republic; 2006 Kazakhstan; 2008 Australia; 2010 Canada; 2012 Ukraine;
2014 Namibia; 2016 Argentina
Follows OECD general objective of collective gain through sharing knowledge
and experience

                             UNECE Training November 2018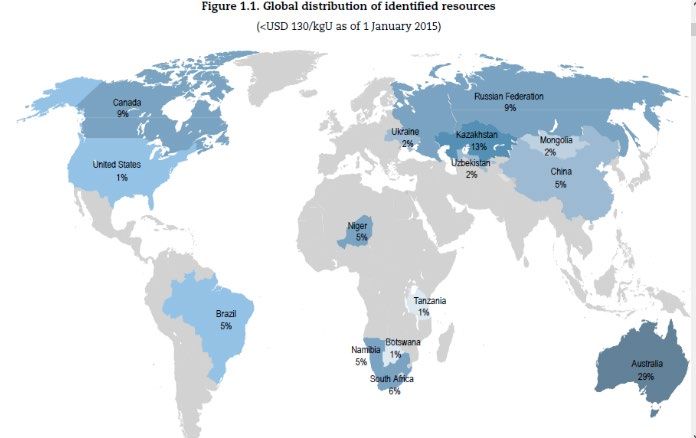
Evolution of the Red Book

The Red Book has increased significantly in scope and depth in 50+ years into a
comprehensive source of information about world uranium resources,
production and demand.
1965: 1st RedBook was 20 pages, with one map and 2 tables, thorium resource
estimates and reports from 11 countries. Uranium from seawater was
discussed in 3 paragraphs and was determined to be sub-economic.
Price categories: USD 5 – 15 - 30/lb U3O8
2016: 546 pages, included 49 country reports, and uranium from seawater was
discussed in two paragraphs and determined to be sub-economic.
Price categories: USD 40 – 80 – 130 – 260 kg/U

                            UNECE Training November 2018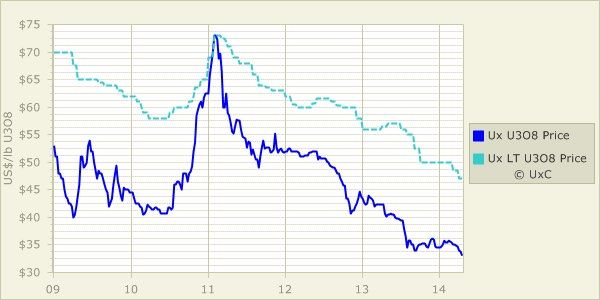
Uranium Group

Members officially nominated by
government authority

~50 members from 30 countries

Wide range of expertise: from geologists
to economists, miners and fuel buyers

Now meets once a year, generally every
second year the meeting is hosted by
country with U production centres

                                             UNECE Training November 2018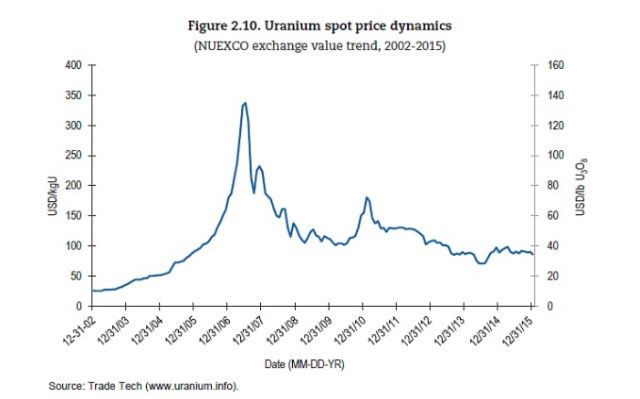
Recent Red Books
Key messages:

Resources more than adequate to
meet high case demand scenarios
Investment and expertise required to bring
resources into production*
Production costs increasing*
Long lead times owing to regulatory
requirements and public resistance in some
countries*

*All could contribute to potential supply challenges over next
5-10 years

                                                 UNECE Training November 2018
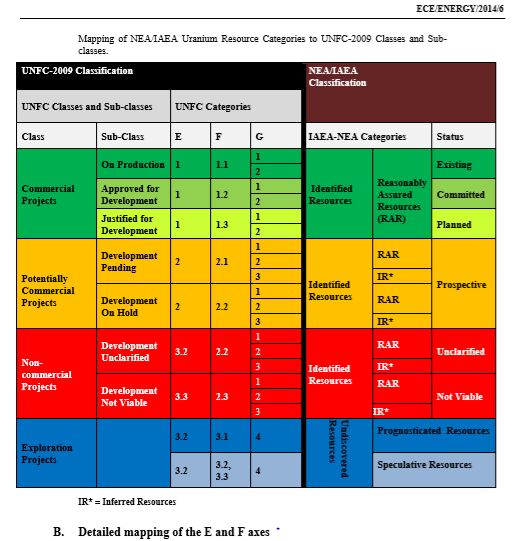
Red Book Resource Classification
                                                                                             Identified resources                               Undiscovered resources
Uranium Production / Requirements
     80 000

     70 000

     60 000

     50 000

     40 000
tU

     30 000

     20 000

     10 000

                                          Year

                     World requirements          World production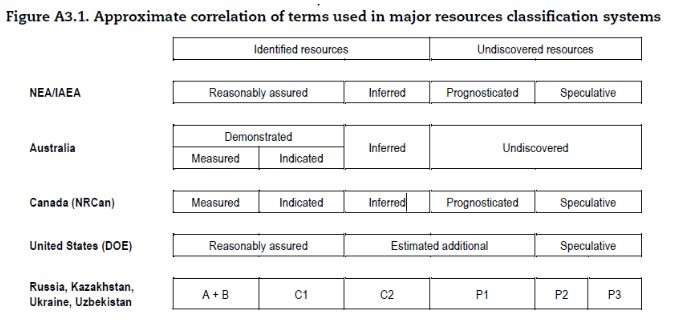
Uranium Market
Since Fukushima, prices have declined owing to uncertainty
                                                                                 Fukushima accident
on the future role of nuclear power
Inventories building as a result of sudden German reactor                        Fukushima accident
                                                                                      Red Book 2014 data
closures and idling of all Japanese reactors                                          reference date

Key to turn around: Japan re-starting reactors, but it will
take time for the inventory to clear after re-starts
Excess enrichment capacity encourages underfeeding of
plants to build additional inventory…utilities reportedly well
supplied
The longer this goes on, the more challenging it gets for
producers

                                                  UNECE Training November 2018
Red Book 2014 – Exploration
Domestic exploration and mine development
expenditures declined dramatically in 2015 as
prolonged period of U oversupply and low prices
continues.
Non-domestic exploration and mine
development expenditures sharply increased in
2012/13, driven mainly by Husab (Namibia)
mine development.
UNECE Training November 2018U Resource Dynamics 2001-2015
9000
8000 Trend since 2001- increasing total
7000 identified resources (IR = RAR +
6000
Inferred) along with production
5000
costs
tU X 1000
4000
2013-2015: Modest (0.1%)
increase in IR and 5.3% decline in
3000
2000
lowest cost resources reflecting
1000
increased mining costs and
0
2001 2003 2005 2007 2009 2011 2013
depletion of resources
YearRed Book 2016 – Distribution of Identified Conventional
Resources (RAR and Inferred)
15 countries represent approx. 95%
of total world U resources
1. Australia (3)
2. Kazakhstan (1)
3. Russian Federation (6)
4. Canada (2)
Note: numbers in black show percentage world resources,
those in red show rank in world production.
UNECE Training November 2018Red Book 2016 - Production
Uranium production continued to increase in 2011
and 2013, although at a slower rate than 2009 and
2010.
2014 production 59 975 tU from 21 countries.
Kazakhstan responsible for 41% of production in
2014, more than Australia and Canada combined.
Canada (16%) and Australia (9%) remain significant
producers and production could increase in
coming years with higher prices.
ISL responsible for 50% of 2014 production.
Development of Husab (Namibia) and Cigar Lake
(Canada) will increase production short-term.
Delayed price recovery driving producers to cut
back production at existing facilities
Energy for Sustainable Development, November 2018Red Book 2016 – Demand
Safety inspections after the Fukushima accident have delayed global development of
nuclear power (notably in China where most significant growth is expected)
Increased safety requirements as a result of inspections have increased costs of nuclear
power generation
Construction delays and cost overruns in major projects have reduced construction plans
and led o bankruptcy of main western vendors
Both low and high demand projections to 2035 were reduced from those in 2014 edition:
the low demand scenario by 8% and the high demand scenario by 10%
Decline in low case principally due to strengthened phase-out policies in Europe, proposed
capacity reductions in France and reduced prospects of additional life extensions to U.S.
fleet
High case declines principally because of delay in development processes in China
UNECE Training November 2018Supply - Demand
Several mine development plans postponed due to low uranium prices post
Fukushima (e.g. Trekkopje, Namibia; Imouraren, Niger; Millennium, Canada, etc)
Some projects still moving ahead (e.g. Cigar Lake, Canada and ISL in U.S.),
including “non-market” based projects (e.g. Husab, Namibia)
Prolonged low price has led to production cutbacks at mines and mills in Canada,
Kazakhstan, Namibia and Niger
54 reactors under construction and several more planned – growth in China and
India expected to be significant – slumping demand expected to reverse and
increase in coming years
How long until demand increases? – primarily dependent on return to service of
reactors in Japan (how many and how quickly) but will take some time owing to
inventory build-up in 2011 and 2012, and earlier
Supply shortage unlikely – several projects in advanced stages of regulatory and
mine development processes – ramping up production should take less time than
usual
UNECE Training November 2018Supply – Demand, Red Book 2016
140 000
120 000
High
Gap between production (red bars)
100 000 and reactor requirements (dashed
line) filled by secondary supplies
Reactor requirements
80 000
Low
tU/year
60 000
40 000
20 000
0
2005 2010 2015 2020 2025 2030 2035
Year
Existing and committed production (A-II) Planned + prospective production (B-II)
Production World reactor requirements Low
(adapted from Red Book 2014)You can also read