Energy Market Wrap 05 July 2021 - Energy Action
←
→
Page content transcription
If your browser does not render page correctly, please read the page content below
Energy Market Wrap 05 July 2021
Contents

Electricity Market Overview ........................................................... 3
Electricity Spot Market .................................................................. 5
Wholesale Gas Market .................................................................. 6
Environmental Certificate Prices ................................................... 8

Energy Action (Australia) Pty Ltd is authorised to provide financial product advice on electricity derivatives and
carbon market related financial products to wholesale clients under the Corporations Act 2001 (AFSL No
362843). The advice contained in this report has been prepared without consideration of a company’s
individual circumstances such as financial situation, risk preferences or corporate objectives. This content
constitutes general advice only. Before acting on any advice, Energy Action recommends that you consider
whether it is appropriate for your circumstances.

 The Energy Market Wrap is prepared fortnightly by the Trading & Pricing team at Energy Action.             2
 This document is not to be reproduced without permission

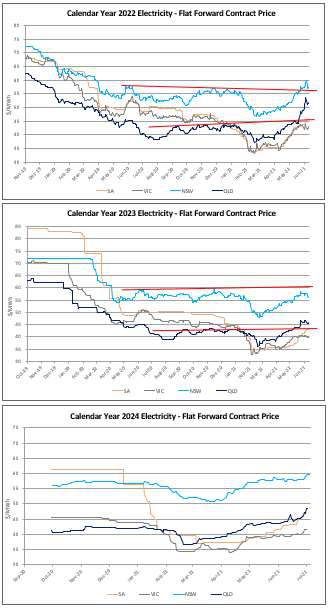
Electricity Market Overview
Electricity prices remain above 10-month
highs for 2022 forward contracts and just
below the 10-month high for 2023 contracts.

Prices re-traced slightly over the past week
but remain in strong uptrend, this now
includes 2024 forward contract prices which
recently set new highs above the 10-month
average, across all states.

We continue to see a strong likelihood that
prices will remain in uptrend for contract
years out to 2025.

Our recent results from RPF’s / Tenders
show 2025 pricing remains in-line with 2024
levels and whilst they have risen over the
past quarter, continue to represent good
value when compared to prices over the past
5 years.

For corporate yet to contract, we continue to
encourage consumers to seek pricing out to
2025.

We are starting to see a ‘new normal’ in the
midst of living with Covid. While widespread
lockdowns may continue, there appears to
be less impact on electricity demand and
less downward pressure on pricing as a
result of Covid disruptions to the economy.

Since the Callide fire, there has been greater
reliance on gas-fired generation (during peak
periods) and greater spot price volatility.
Both gas and electricity prices remain highly
volatile with short-term factors driving current
pricing and making the longer-term outlook
more difficult to forecast.

 The Energy Market Wrap is prepared fortnightly by the Trading & Pricing team at Energy Action.   3
 This document is not to be reproduced without permission

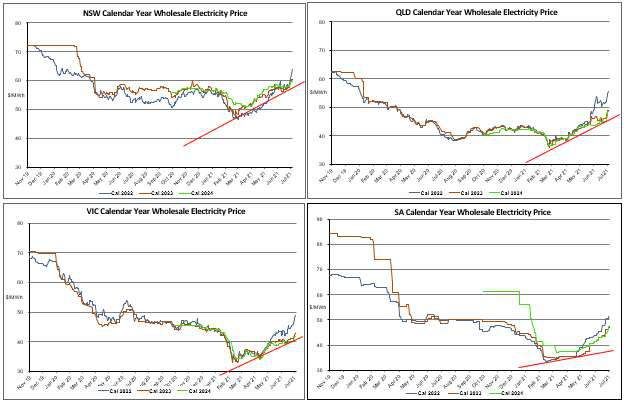
We have updated the following charts which show ‘flat’ electricity pricing by State. Since our previous update, the
gradient (or rate of price increase) in both QLD and NSW for 2023 electricity has increased. This suggests, both
states now have greater likelihood that prices will continue to increase. VIC and SA prices remain in up-trend but
to a lesser extent than QLD and NSW.

 The Energy Market Wrap is prepared fortnightly by the Trading & Pricing team at Energy Action.            4
 This document is not to be reproduced without permission

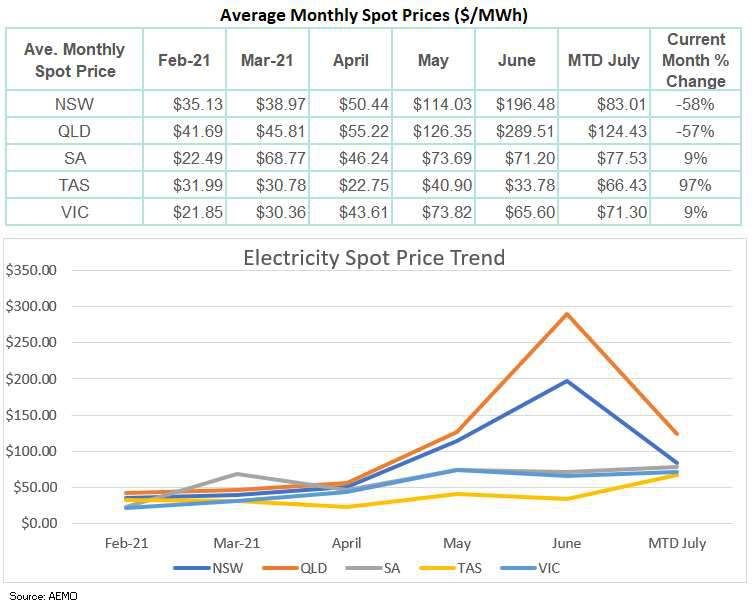
Electricity Spot Market
July month-to-date spot prices retraced in NSW and QLD which saw them drop by 58% and 57% respectively
(compared to the prior month average). Tasmania is currently showing the largest increase of 97% (noting we are
only 5 days into the MTD period). In SA, prices increased by 9%, as did average price levels in VIC. We are now
seeing greater alignment between the northern states of NSW and QLD (both decreasing by similar rates) and a
separate alignment of the southern mainland states with VIC and SA both increasing by 9%. The outlier is Tasmania
with a 97% increase in average spot price, compared to last month. The fundamental factors driving this increase
relate to the outage in QLD and increase output from higher cost generation.

Renewable generation remains the key to longer-term influence over spot prices and the continuing risk of further
rationalisation in the baseload generation sector. Although renewables have very low short-run marginal costs, their
impact is felt through the effect on merit order dispatch, particularly impacting baseload generation. At some stage
in the future, renewable generation projects will need to recover their long-run marginal costs, associated with
capital and returns to equity, placing greater upward pressure on electricity price levels.

 The Energy Market Wrap is prepared fortnightly by the Trading & Pricing team at Energy Action.             5
 This document is not to be reproduced without permission
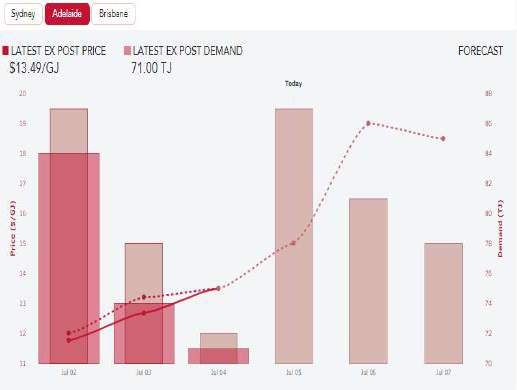
Wholesale Gas Market
We’ve been hearing lots of conversations about the weather – and for good reason! Gas hub prices hit a high of
$18.50/GJ earlier today (05 July 2021). We are seeing significant short-term demand and unseasonal cold
weather, pushing prices to record levels. Sydney gas hub prices went through the roof to $14.75/GJ, along with
Adelaide at $13.49/GJ and Brisbane recording a price of $13.49/GJ.

In addition to Callide Power Station’s outage and consequential increase in demand for gas-fired generation,
there has been a significant increase in the demand for gas as a heating fuel.

During early May, generation output from gas-fired sources amounted to 4% or 18 GWh. Approximately one
month later, gas-fired power generation accounts for 82.9 GWh, or around 15% of NEM load. This huge increase
in gas usage has led to hub prices going through the roof.

Gas usage is always greater during winter however the market adjusts for the increase by factoring winter
demand into production. However, unexpected additional heating demand has emerged from one of the coldest
winters in 5 years. The unexpected additional gas required for electricity generation and heating demand has
caused a short-term spike across all gas hubs.

Demand is expected to reduce when the cold weather passes, and this is likely to translate into lower gas hub
pricing. Future gas prices are still trading at an average of $7.42/GJ for CY22 at Wallumbilla, and $6.98/GJ for
VIC CY22.

While the past week has produced server price impacts, wholesale gas customers are still averaging gas prices
below the current retail market. The extent of the savings from a hub arrangement, compared to retail contract will
be directly affected by how long the current cold snap lasts.

 The Energy Market Wrap is prepared fortnightly by the Trading & Pricing team at Energy Action.             6
 This document is not to be reproduced without permission
The following charts show prices during the past week have increased significantly. Victorian prices increased the
most, setting a record price of $18.50/GJ.

Charts courtesy of AEMO: https://www.aemo.com.au/energy-systems/gas/short-term-trading-market-sttm/data-sttm/data-dashboard-sttm

 The Energy Market Wrap is prepared fortnightly by the Trading & Pricing team at Energy Action.                             7
 This document is not to be reproduced without permission
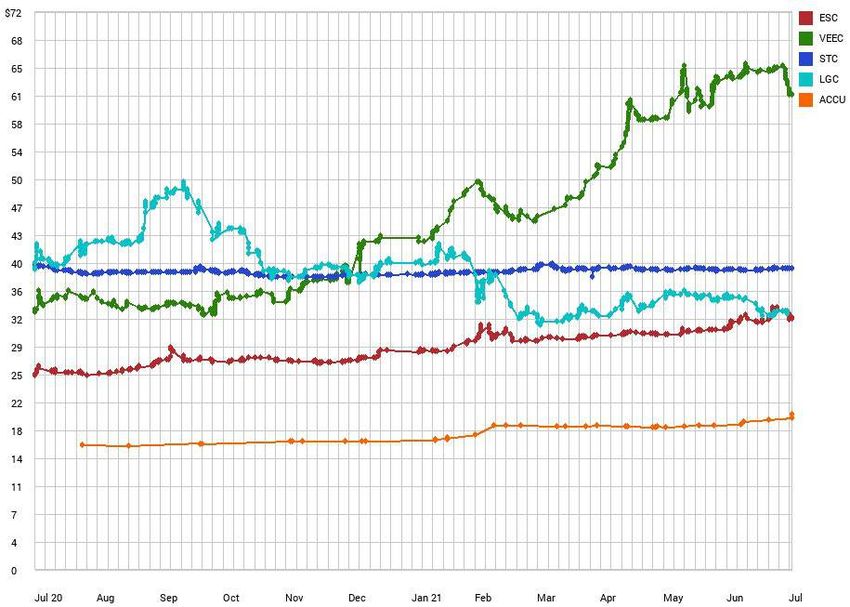
Environmental Certificate Prices
LGC’s traded slightly lower this week to $33.25/certificate.
VEEC’s traded lower in response to certificate supply disruptions associated with Covid at $61.25/certificate
ESC’s continue to trend higher, currently trading at $32.50/ certificate.
STC’s remain relatively stable just below the retail price cap at $38.85/certificate.
ACCU’s (Australian Carbon Credits) are currently trading higher at $20.00 /certificate.
Source: Demand Manager: https://www.demandmanager.com.au/certificate-prices/
The Energy Market Wrap is prepared fortnightly by the Trading & Pricing team at Energy Action. 8
This document is not to be reproduced without permission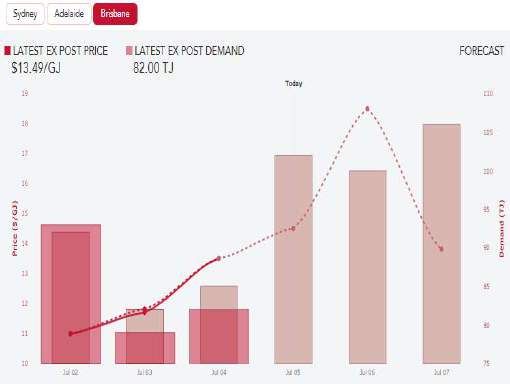
The LGC forward curve continues to show significant price backwardation with the cost of 2025 LGCs currently
trading at $8.70/ certificate.

        Chart Courtesy of Mercari: http://lgc.mercari.com.au/

 The Energy Market Wrap is prepared fortnightly by the Trading & Pricing team at Energy Action.        9
 This document is not to be reproduced without permission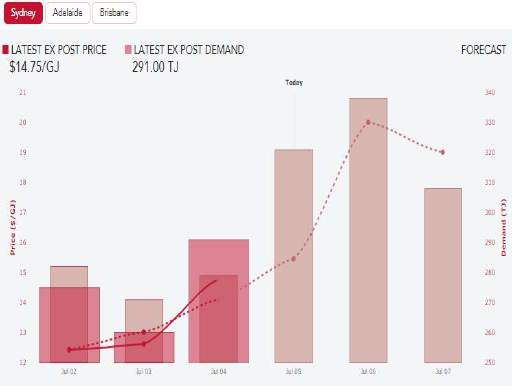
You can also read