Manhattan Market Report - Q1 2020 - Compass Real Estate
←
→
Page content transcription
If your browser does not render page correctly, please read the page content below

Q1 2020

Manhattan
Market Report

                95 Greene Street #PHABE
                   Photographer: Will Ellis
150 Charles Street #8AN
Photographer: Tim Waltman

To no one’s surprise, the coronavirus      January sales were close to last year’s,   estate market remains in uncharted
pandemic has made a dent in NYC            while February had 10% more sales          territory. Given the current conditions
residential real estate. The unexpected    than in 2019. However, March               in New York City and the 30-day
pandemic unearthed a never seen            performance marks the downturn of          extension of national containment
before economic state in the U.S. and      the market. The first week of March         guidelines, we anticipate a
globally. Its e ect is reflected by         was hopeful with 8% more contracts         significantly softer market in
reduced sales and stagnant markets in      signed, but this boost did not carry       Manhattan for at least the next 30
all NYC neighborhoods.                     through the remainder of the month.        days. Recent stock market
                                           As the severity of the COVID-19            performance and the overall stressed
New York City, the current US              outbreak in the area increased,            economy will certainly be
epicenter of the virus, has been           activity in the market sharply             contributing factors in overall activity.
significantly impacted. Open houses         declined. This week alone, contracts
and showings were cancelled, taking        plummeted 42% year-over-year, 37%          We hope that everyone stays safe and
an inevitable toll on market activity in   of active listings saw discounts and       healthy and that our report provides
the last weeks of March. If the            new inventory was almost non-              useful information during this
anticipated trajectory of the virus        existent.                                  unprecedented time.
holds, we’re at the beginning of this
curtailed real estate activity.            Like the virus, the state of the real

                                                 REGIONAL PRESIDENT, NY REGION        SENIOR MANAGING DIRECTOR

                                                 Rory Golod                           Elizabeth Ann
                                                                                      Stribling-Kivlan
Methodology                                          05
                           Market Highlights                                    06
                           Sales by Property Type                               07
                           Sales by Price Point                                 08
                           Inventory by Unit Type                               09
                           Inventory by Price Point                             10

                           SOURCES
                           Proprietary database,
                           ACRIS (Automated City Register Information System)

95 Greene Street #PHABE
Photographer: Will Ellis
Methodology

                            Geography covered in this report is      Months of Supply is an estimated time
                            Manhattan.                               it would take to sell all current active
                                                                     listings based on the trailing 12-
                            Inventory is calculated based on all     months sales rate.
                            properties actively listed during the
                            quarter at the time the report is        Time On Market is calculated by how
                            prepared.                                many properties entered contract
                                                                     during the quarter in the given period.
                            Contract Signed figures for the
                            current quarter are based on publicly    Discount is the percentage di erence
                            reported transactions at the time the    between the initial list and recorded
                            report is prepared. The signed price     sale price.
                            reflects the latest available asking
                            price.                                   Current Quarter is reflective of the
                                                                     initial day of the quarter until the 20th
                            Recorded Sales figures for the current    day of the closing month of the
                            quarter are based on known closings      quarter. These numbers will be
                            recorded at the time the report is       updated in subsequent reports to
                            prepared.                                reflect the dataset of the entire
                                                                     quarter.
                            Median Price is the middle price of a
                            given dataset.                           Quarters
                                                                     Q1: January 1 - March 31
                            Average Price is the sum of all prices   Q2: April 1 - June 30
                            divided by the total number of           Q3: July 1 - September 30
                            properties.                              Q4: October 1 - December 31

27 North Moore #7CD
Photographer: Donna Dotan
Economic stressors led to increased
                          time on market and discounts.

                          $1,958,611                   $1,353
                          Average                      Average Price
                          Sales Price                  Per Square Foot

                          $1,100,000                   175
                          Median                       Average Days
                          Sales Price                  on the Market

                          $2,553,612                   10%
Manhattan Market Report

                          Average                      Average
                          Condo Price                  Discount

                          $1,392,997                   42%
Compass

                          Average                      of Properties Took
                          Co-op Price                  More than 180 Days
                                                       to Enter Contract

06
                                                                               150 Charles Street #8AN
                                                                            Photographer: Tim Waltman
Recorded Sales
                          BY PROPERTY TYPE

                           Condos saw the most significant price changes, with declines in all
                           metrics

                           Co-ops were slightly more a ordable despite higher median and
                           average prices

                           Co-ops sold 22% faster than condos on average

                           3-bedroom units saw their median price decrease 4% and average
                           price decrease 7%

                           Units with four or more bedrooms had an 11% higher median price, a
                           result of price distribution changes in the lower half of the market
                                                                                                                                       27 North Moore Street #7CD
                                                                                                                                        Photographer: Donna Dotan

                          Condo Recorded Sales                                                    Co-op Recorded Sales
                                                      Q1 2020      Q1 2019      %Δ (YoY)                             Q1 2020      Q1 2019          %Δ (YoY)
Manhattan Market Report

                          # UNITS                     796          780          2%                # UNITS            1,066        1,055           1%

                          AVERAGE DISCOUNT            11%          10%                            AVERAGE DISCOUNT   9%           8%

                          MEDIAN PRICE                $1,550,000   $1,608,000   -4%               MEDIAN PRICE       $840,000     $820,000        2%

                          AVERAGE PRICE               $2,553,612   $2,801,820   -9%               AVERAGE PRICE      $1,392,997   $1,305,763      7%
Compass

                          AVERAGE PPSF                $1,585       $1,745       -9%               AVERAGE PPSF       $1,043       $1,074          -3%

                          AVERAGE SF                  1,326        1,347        -2%               AVERAGE SF         1,125        1,043           8%

07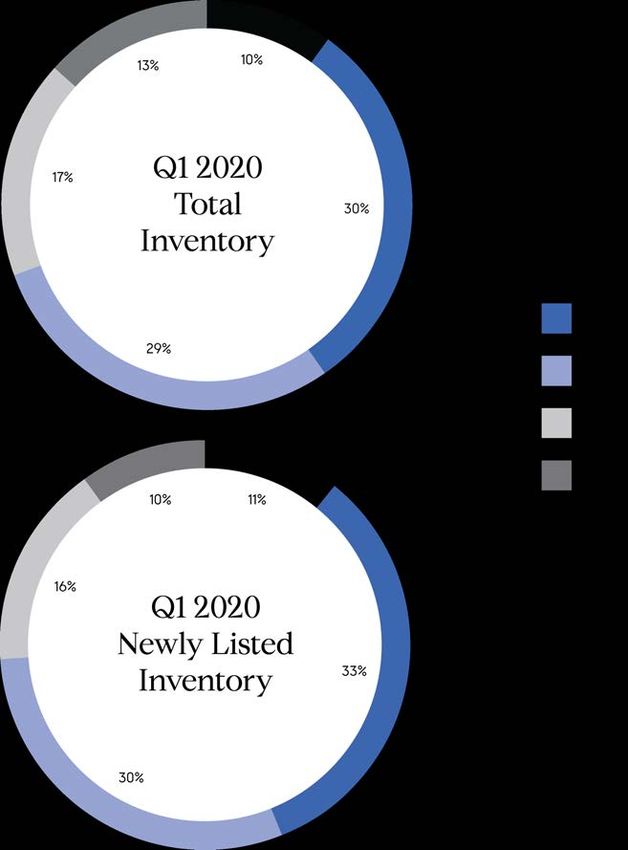
Recorded Sales
                          BY PRICE POINT                                                             Q1 2020 Percentage of Units

                            The average price per square foot in properties priced less than $500K
                            and $1-3M fell 8%

                            Properties sold between $5-10M were on the market 29% longer than
                            usual

                            The $5-10M bracket reached a 15% average discount, a 5% increase
                            from last year

                            Despite a 14% increased average time on market, the $500K-1M price
                            point saw 41% sell within 90 days, the most of any group
                                                                                                     Q1 2020 Average PPSF
                            The $5-10M and $20M+ price points saw price declines, while all other
                            groups increased, though only slightly (2%)

                            Properties between $500K-1M reached their highest market share on
                            record, while those under $500K were at their lowest

                            Studios, on average, were 10% more a ordable than last year, despite
                            falling into multiple price brackets depending on submarket
Manhattan Market Report

                            Upper East Side condo sales saw a 35% lower average price, but were
                            also 19% smaller compared to last year
                                                                                                     Q1 2020 Average Size
                            The average sales price of co-ops in Midtown East was up over 40%,
                            with many new development sales going through
Compass

08
Manhattan Market Report
Compass

                          95 Greene Street #PHABE
09                           Photographer: Will Ellis
Condo Inventory
Co-op Inventory
Compass is a licensed real estate broker and abides by Equal Housing Opportunity laws. All material presented herein is intended for informational purposes only. Information is
161 Hudson Street #PH9A/8B   compiled from sources deemed reliable but is subject to errors, omissions, changes in price, condition, sale, or withdrawal without notice. No statement is made as to the
                             accuracy of any description. All measurements and square footages are approximate. This is not intended to solicit property already listed. Nothing herein shall be construed as
Photographer: Will Ellis     legal, accounting or other professional advice outside the realm of real estate brokerage.
You can also read