Getting ready for a Decade of Healthy Ageing - unece
←
→
Page content transcription
If your browser does not render page correctly, please read the page content below

27-28 September 2018, Bilbao
2nd International seminar on the Active Ageing Index

                   Getting ready for
              a Decade of Healthy Ageing

                      Dr Ritu Sadana, Senior Health Advisor
            Dr Jotheeswaran Amuthavalli Thiyagarajan, Epidemiologist
                   Department of Ageing and Life Course, WHO
 sadanar@who.int                                         @RituSadana
 amuthavallithiya@who.int                                @AT_Jothees
DREAM

VISION

Healthy Ageing as the process     Health equity implies that
of developing and maintaining     ideally everyone should have
the functional ability that       a fair opportunity to attain
enables wellbeing in older        their full health potential and
age. Functional ability is “all   that no one should be
the health-related attributes     disadvantaged from achieving
that enable people to be and      this potential. It's about
to do what they have reason       social justice and social
to value.”                        inclusion.
1. Healthy ageing, leave no one behind
2. Decade 2021-2030
3. Baseline report, 2020

1. Healthy ageing, leave no one behind
2. Decade 2021-2030
3. Baseline report, 2020

"A continuous phenomenon, an inclusive
concept, not equivalent to disease-free, not
simply age dependent"

Healthy Ageing trajectories - continuous

  World Report on Ageing and Health 2015
Healthy ageing – unpack it
Intrinsic Capacity Functional Ability                  Environment
   Cognitive               Learning and applying    Products and
   Psychological            knowledge                 technology
   Sensory
                            Communication            Natural and built
   Neuromusculoskeletal
   Voice and speech        Mobility                  environment
   Cardiovascular          Self-care                Support and
   Haematological          Domestic life             relationships
   Respiratory             Interpersonal            Attitudes
   Immunological            interactions and         Services, systems and
   Digestive                relationships             policies
   Metabolic
                            Major life areas
   Endocrine
   Genitourinary           Community, social
   Reproductive             and civic life
   Skin, hair and nails

                                                                           8
Healthy Ageing trajectories
- unmask inequities
 Distribution – differences accumulate including unfair,
 avoidable or preventable differences

Intrinsic
Capacity
CAN WE
MEASURE IT
Intrinsic capacity, cross sectional,
by age, 6 countries, WHO SAGE

                              Source: World Report on
                              Ageing and Health

                              Data Source: SAGE wave 1,
                              cross sectional
                              data, 6 countries, 2007-
                              2010
Intrinsic capacity, India and Russia,
men and women, age 50 plus, by household wealth
Poorer Richer
Data Source: SAGE wave 1, cross sectional data, 2 countries Sadana et al. forthcomingHand grip strength, India and Russia, men and
women 50 years plus, by household wealth quintiles
India Russia
45 Right Hand - men
Mean grip strength, kg
Right hand - women
40
Left hand - men
35 Left hand - women
30
25
20
15
10
1 2 3 4 5 1 2 3 4 5
Wealth quintiles Wealth quintiles
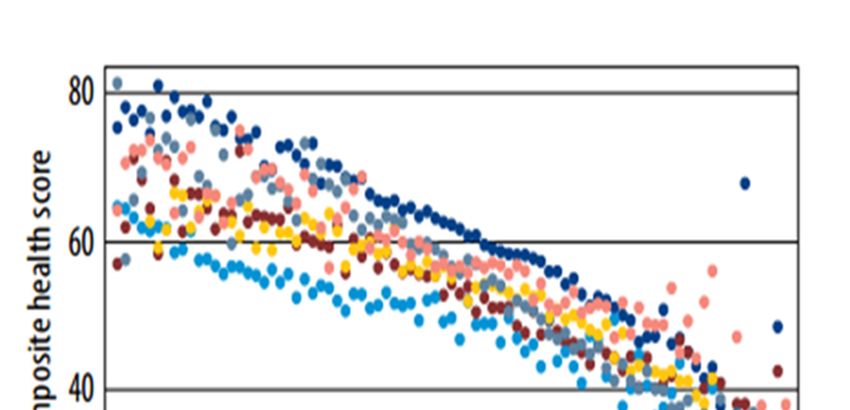
Data Source: SAGE wave 1, cross sectional data, 2 countries Sadana et al. forthcomingDistribution of intrinsic capacity score
(WHO world population standard, 50+, both sexes)
.05
.05
.05
Pull up
.04
.04
.04
China Russia India Shift
.03
.03
.03
Density
Density
Density
.02
.02
.02
Narrow
.01
.01
.01
0
0
0 20 40 60 80 100 0 0 20 40 60 80 100
0 20 40 60 80 100
composite composite composite
.05
.05
.05
.04
.04
.04
South Ghana
Africa Mexico
.03
.03
.03
Density
Density
Density
.02
.02
.02
.01
.01
.01
0
0
0
0 20 40 60 80 100 0 20 40 60 80 100 0 20 40 60 80 100
composite composite composite
Source database: SAGE, WHO, wave 1, cross sectional data Sadana et al. forthcomingWHAT DOES THIS MEAN
Intrinsic capacity score distribution for ages 50+, Russia
                 .04                                                Private sector
                                                                    workers, women 57.6
                                                                                          Private sector
                                                         Informal sector                  workers, men 62.4
                                                         workers, men, 54.8
                           .03
                distribution

                                      Informal sector
                                      workers, women,
Density

                                      48.1
                   .02

                                      90+, lowest
                                      wealth quintile,
                                      least educated,                                           50-54yrs, highest wealth
                                      35.8                                                      quintile, most educated
                                                                                                66.2
      Frequency
      0     .01

                                  0    10         20       30      40         50   60     70    80         90       100
                                                             Intrinsic capacity score Sadana et al. forthcoming
Intrinsic capacity score distribution for ages 50+, India
.04 Informal sector
Private sector workers, men, 48.2
workers, women
45.4 Private sector
Informal sector workers, men 54.1
.03
workers, women,
distribution
42.5
Density
.02
90+, lowest
wealth quintile, 50-54yrs, highest wealth
least educated, quintile, most educated
.01
Frequency
26.0 62.2
0
0 10 20 30 40 50 60 70 80 90 100
Intrinsic capacity score
Sadana et al. forthcomingCurvilinear trajectories of IC and cohort effects in later lives of older people in Britain Amuthavalli Thiyagarajan et al. forthcoming
Effect of cohort on cognitive capacity by
         childhood socioeconomic position

Solid line = high socio economic position
Dash line = low socio economic position     Amuthavalli Thiyagarajan et al. forthcoming
"I am convinced that the commitments outlined by the Strategy will help countries … improve health equity across the life course and other development goals." - Foreword, Global Strategy and Action Plan on Ageing and Health
1. Healthy ageing leave no one behind
2. Decade 2021-2030
3. Baseline report, 2020

"By 2020, establish evidence and partnerships
necessary to support a Decade of Healthy Ageing
from 2021 to 2030"
New WHO
                                          Baseline
                                          report on
                                          Healthy
                                          Ageing

2002   2015   2016   2017   2018   2019   2020               2030

                                            Decade of
                                            Healthy Ageing
                                            2021-2030
What impacts do we expect by 2030? What would success look like globally and nationally in 2030? What good practices and new evidence can guide actions that will increase overall impact and reduce inequities? To support healthy ageing, are there specific global public goods we should ensure?
Clarify concepts, determinants and pathways,
and outcomes of interest - "blocks"
                                                           Health and
Link measures to each                                      well being
Report on each "block" separately, to
facilitate interpretation on what can be done,   Systems, built
and progress
                                                 environment, other
Report on outcomes, to be accountable            interventions
                                 Strengths,
Avoid combining
determinants and outcomes
                                 exposures,
(UHC Index)                      vulnerabilities
                Biologic and
                Social
                stratification
Root or
structural
determinants
1. Healthy ageing leave no one behind 2. Decade 2020-2030 3. Baseline report, 2020 "global status report on healthy ageing for submission to the 73rd WHA (May 2020), reflecting agreed upon standards and metrics and new evidence on what can be done in each strategic theme, to inform and provide baseline data for a Decade of Healthy Ageing 2020-2030”
1. Where we are – 2020
  Global baseline – levels and distribution - Intrinsic capacity, functional ability,
  enabling environments and other important indicators such as care
  dependence

            - new analysis of existing nationally representative data
            - new data from nationally representative surveys

2. Where we want to go – by 2030
Goal alignment, targets and Indicators – projections towards potential targets
Scenarios to support national planning & investments (informed by projection
work)

3. How are we going to get there
What can be done (reflecting systematic reviews & norms in key areas) relevant
to different contexts
Global Strategy midterm country progress May 2018 Cross-sectional Only 54 Longitudinal Only 35 10 indicators full results: www.who.int/ageing/commit-action/measuring-progress/en/
Thank you                  WHO Geneva
For further information:
sadanar@who.int
amuthavallithiya@who.int
You can also read