Latin America and the Caribbean's shipping industry in the international context - Cepal
←
→
Page content transcription
If your browser does not render page correctly, please read the page content below
Latin America and the Caribbean’s shipping industry
in the international context
Ricardo J Sanchez
Agosto 28, 2020
Maritime logistics can be considered the backbone of trade, since it transports around 84% of volumes
traded worldwide and almost 70% of global trade value. Similar ratios can be found in Latin America
and the Caribbean, particularly in the South American and the Caribbean subregions. In this context,
ports play a significant role in ensuring a wide distribution of goods through supply chains, including
those considered essential, such as food and medical supplies.
The total international trade carried by water1 in 2018 reached 11.81 billion metric tons (Clarkson,
2020). According to preliminary figures, 2019 had a record of 11.86 billion tons carried, which
amounts to a year-on-year growth of 0.4%. Current estimates show that by 2020 global cargo
movement will reach 11.2 billion tons, a year-on-year drop of 5.2%.
In consequence, if such figures are confirmed, the impact of the pandemic on maritime cargo
transport activity will be a setback of over three years, according to the evolution of cargo volume
transported. In fact, between 2016 and 2017, the equivalent annual charges reached 11,052 million
and 11,503 million tons, respectively (Clarkson, 2020).
In recent years, Latin America and the Caribbean accounted for about 17% of the world's total
maritime cargo. Nonetheless, the regional share in the maritime transport industry is smaller. Even
though most of Latin America's largest countries had their own shipping companies (either private or
state capital) until 20 or 30 years ago, in practice the impact of those remaining in the market is much
lower. According to UNCTAD (based on the Clarkson data), considering all of the 348 companies to
have domicile in some country in the region, the fleet of vessels (greater than 2000 GTi) is equivalent
to only 2% of the global total, representing 1.19% of the GT and 1.24% of the overall DWT. If one
separates Latin America from the island states of the Caribbean, the GT share of each of these
subregions is 1.09% and 0.10%, whereas their DWTii share is 1.17% and 0.07%, respectively. In other
words, the region mobilizes more than 17% of exports plus world imports, but its own transport
capacity does not reach 2% of the total industry, globally.
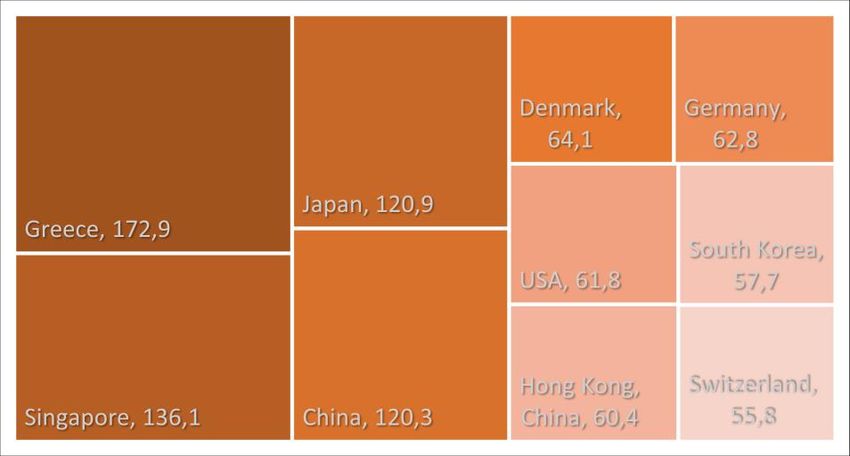
In the world of late 2019, the country to control the largest commercial fleet by tonnage was Greece,
with 173 million gross tons, followed by Singapore, Japan and China. The following figure shows the
top ten countries in terms of commercial fleet, among which none from Latin America and the
Caribbean is included.
1
It includes the following types of loads: iron, coal, dried bulk, gas and oil and their derivatives, chemicals, containers,
and other lower loads.
1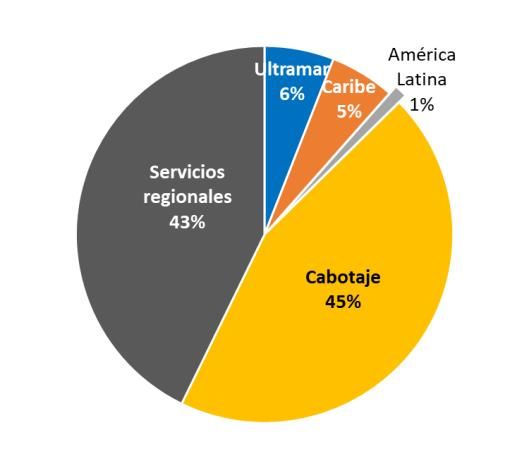
Figure 1 Country-operated fleet, top 10 (in tonnage)

                         Source: the authors based on Clarkson, several editions
The shipping industry of Latin America and the Caribbean has distinctive features, which are displayed in
¡Error! La autoreferencia al marcador no es válida.: companies in this industry are mostly private-owned,
with small fleets, geographic coverage of not-too-far distances (in fact, mainly short-distance geographical
coverage) and of diversified specialization.
              Figure 2 Shipping industry in Latin America and the Caribbean, key indicators

                   a) Ownership                                           b) fleet size

          c) geographical specialization                    d) specialization by type of transport

                                                     2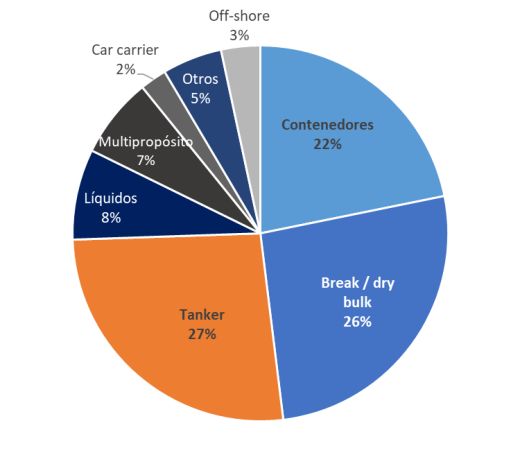
Source: Direct research by authors based on UNCTAD data
          Note: on figure d), “Others” includes bunker, roro, reefer, multimodal and tugboats
The analysis is based on the 314 surveyed companies that were active as of April 2020 (see main table in
attachment). Of those, 94% of the ownership was mostly private (albeit with a marked prominence of
companies that were 100% private). Only companies operating at least one vessel of 2,000 or more GT
were included, of which 86% had between one and twenty vessels (within this category, 159 companies
operated between one and three vessels each).
The analysis of the geographic coverage of these companies indicates that 45% offered cabotage services
and another 43% provided services to neighboring countries, while only 6% reached higher distance
destinations within Latin America and the Caribbean, and the remaining 6% provided services overseas.
As per the type of vessels operated, 61% were dry or liquid bulk, including oil and derivatives; 22%
corresponded to supply container services; 7% were multipurpose; 3% corresponded to supply offshore
services; and 2% to vehicle transport.
According to data from UNCTAD, Latin American and Caribbean companies account for only 0.39% of
container transport capacity, measured in teu, of which teu capacity of the subregions of Latin America
and the Caribbean are 0.37% and 0.02%, in that order.
¡Error! La autoreferencia al marcador no es válida.showcases the ranking with the ten largest operators
in the market (by TEU capacity handled as of June 11, 2020). Together, these operators account for more
than 57% of the active vessel fleet and 86% of container mobilization capacity.
Table 1 Looking at the composition of the global fleet by country of domicile of these companies,
Denmark, China, Switzerland, France, Taiwan, Germany, Japan, South Korea, Singapore and Israel (the top
ten countries) amount to 91% of the total. By adding the companies of the following ten (those
headquartered in Indonesia, United States, Iran, United Arab Emirates, Turkey, Holland, United Kingdom,
Italy, and Thailand), the share reaches close to 96%. It is clear that LAC countries have no major impact on
global transport. Annex 1 addresses the ownership of container shipping companies worldwide, either by
domicile of firms or by state or private ownership thereof.

                                                     3
¡Error! La autoreferencia al marcador no es válida.showcases the ranking with the ten largest operators
in the market (by TEU capacity handled as of June 11, 2020). Together, these operators account for more
than 57% of the active vessel fleet and 86% of container mobilization capacity.
Table 1 Ranking of the Top 10 container lines in the world
Share of global
# Operator TEU Total Fleet
capacity
1 APM-Maersk 3,963,399 16.70% 654
2 Mediterranean Shipping Co 3,675,400 15.50% 550
3 COSCO Group 2,870,792 12.10% 469
4 CMA CGM Group 2,679,888 11.30% 488
5 Hapag-Lloyd 1,716,951 7.20% 236
6 ONE (Ocean Network Express) 1,554,780 6.50% 211
7 Evergreen Line 1,227,385 5.20% 190
8 Yang Ming Marine Transport Corp. 603,320 2.50% 92
9 HMM Co Ltd 551,732 2.30% 67
10 PIL (Pacific Int. Line) 350,390 1.50% 111
Source: Alphaliner Top 100 (2020).
The following figure shows how the nominal overall transport capacity is distributed across subgroups of
companies, categorized according to their ranking position.
Figure 3 Distribution of the carrying capacity of the world's 100 largest container lines
Source: calculated based on CXSMarine-Alphaliner data
i
GT, an acronym for the "Gross Tonnage of a Ship" unit of measure, represents the total volume or interior capacity
of all enclosed spaces of a vessel, as determined by the provisions of the International Maritime Organization's
International Convention on Ship Archery, 1969.
ii
DWT, the "Dead Weight Tons" unit of measurement, represents the metric ton weight for the maximum payload,
plus fuel and lubricating oil, water and cloths, crew and supplies.
4You can also read