From Phileas Fogg to Yuri Gagarin

Page created by Shannon Gray
 
CONTINUE READING
From Phileas Fogg to Yuri Gagarin
From Phileas Fogg to Yuri Gagarin:
                           ...
Prologue:

                      “ … Has the world grown smaller?

Certainly, returned Ralph. I agree with Mr. Fogg. The world has grown smaller,
since a man can now go round it ten times more quickly than a hundred years
                                    ago. …

 You have a strange way, Ralph, of proving that the world has grown smaller.
              So, because you can go round it in three months.

                  In eighty days, interrupted Phileas Fogg. …

It's absurd! cried Stuart, who was beginning to be annoyed at the persistency of
                                   his friend.”

                           Jules Verne, Around the World in Eighty Days, 1873

                                                   © Kari Liuhto 27.10.2011, Moscow
From Phileas Fogg to Yuri Gagarin
Russia’s modernisation path(s)
Russia in the 1970-    Russia in this           Russia
 1990s: Russia’s         millenium:           tomorrow:
    industrial        How to turn Russia    two major paths
 competitiveness            more           in modernisation
   deteriorates         innovative ?

                                              State-led,
                                               military-
                                              oriented
                                               reform
                                                  vs
                                                  ?
                                             Private firm
                                             dominated,
                                             civil society-
                                               oriented
                                                reform
From Phileas Fogg to Yuri Gagarin
Modernisation is not self-evident path
for Russia, though it would be highly needed

                                   Source: Liuhto 2009
From Phileas Fogg to Yuri Gagarin
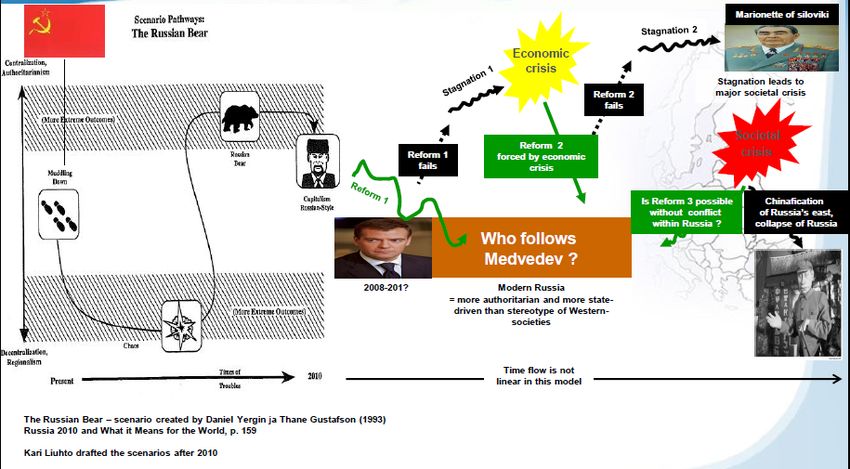
Russia’s innovation / R&D activity today (1)

Figure 1

Expenditure on R&D

                                                               Gross expenditure on R&D as share of GDP in 2007
                                                               and relative change in 1997-2007, percentage points                                            Country’s share (%) of world’s GERD in 2007
                                                                (circle size corresponds to total GERD, USD mln.)
                                                         High 5%
                                                                                                                                            Israel                      USA                                            34,13%
                                                                                                                                                                      Japan                           14,04%
                                                                                                                                                                  Germany                     7,88%
                                                                                                                                                                     France                5,06%
                                                                                                                                                                      China               4,43%
                                                               4%
                                                                                                                                                                South Korea             3,13%
                                                                                                    Japan                                                            Russia           1,35%
                                                                                                                   Finland
   Gross expenditure on R&D as share of GDP in 2007, %

                                                                                                                              South Korea                               India         0,88%
                                                                                                                                                                    Finland          0,79%
                                                                               USA                                                                                     Israel        0,72%
                                                               3%
                                                                                                                                                                     Turkey          0,43%
                                                                                                                                                                South Africa         0,25%
                                                                                                            Germany
                                                                                                                                                                                0%         10%         20%     30%      40%
                                                                     France
                                                                                                       Canada
                                                               2%
                                                                                                                                                                Change of the country’s share in world’s
                                                                                                             Czech Rep.   China                                     GERD between 1997 and 2007
                                                                                    Russia         Hungary                                                           China                                              103%
                                                                                                   Belarus     Estonia                                              Turkey                                       79%
                                                               1%    Ukraine
                                                                                                        South Africa                                           South Africa                              40%
                                                                                   India
                                                                          Poland
                                                                                                                                                                      Israel                            38%
                                                                                           Chile      Turkey                                                   South Korea                           23%
                                                                     Kazakhstan
                                                                                                                                                                   Finland                         13%
                                                                                                                                                                     Japan                       5%
                                                               0%
                                                                                                                                                                       India                    1%
                                                                -0,5%            0,0%              0,5%             1,0%         1,5%                  2,0%
                                                                          Change of the share of GERD in GDP between 1997 and 2007,                              Germany                        0%
                                                         Low
                                                                                                     percentage points                                              Russia          -5%
                                                                    Low                                                                              High              USA         -9%
                                                                                                                                                                    France      -16%

 Source: UNESCO Institute for Statistics, W orld Bank                                                                                                                          -40%        0%          40%     80%      120%

 Source: Prazdnichnykh & Liuhto, PEI 2010
Russia’s innovation / R&D activity today (2)
Russia’s innovation / R&D activity today (3)
Russia’s innovation / R&D activity today (4)

             Companies in Fortune Global 500            Companies in top 1,000 R&D investors

                2005               2009                           2005           2009

Brazil             3                   6                                 3          3

Russia             3                   8                                 2          1

India              5                   7                                 1         12

China             16                 37                                  3          5

Europe *         175                180                            294           333

USA              176                140                            423           378

                                  *     Europe excluding Russia
                                  Sources: DIUS (2009); Fortune (2009)
Russia’s innovation / R&D activity today (5)

 Figure 4

Sample characteristics (innovation), %
                    Presence of R&D department                                                      Main sources of innovation

     The company                                                                     Company's own R&D department                                         47 %*
      doesn’t have
   R&D department,                                                                   Foreign companies - suppliers of
                                                                                            equipment or parts                                     38 %
              49%
                                                      The company has an             Russian companies - suppliers of
                                                      R&D department,                       equipment or parts                              28 %
                                                      51%
                                                                                 Company's own departments, except
                                                                                              R&D                                          25 %

                                                                                Russian engineering, design and other
                                                                                       specialized companies                         16 %

                                                                                    Russian institution of science and
                  Presence of innovation strategy                                       technology or university                    15 %

                                      Documented as a separate strategy,        Foreign engineering, design and other
      The company doesn't                                                                                                       8%
                                                                                       specialized companies
   have innovation
     В компании    strategy,
                 нет                  5%
исследовательского 24%                                                            Acquisition of patents, licenses and
    подразделения,                                 Documented as a part                                                        6%
                                                                                  know-how from Russian companies
                                                   of overall strategy,
                49%
                                                   20%                           Acquisition of patents, licenses and
                                                В компании существует          know-how from foreign companies (with           5%
                                                исследовательское                   or without Russian presence)
                                                подразделение,                       Foreign institution of science and
 Innovation strategy                            51%                                      technology or universi ty            3%
   exists only in top
  managers' minds,
                51%                                                                                                       0 % 10 % 20 % 30 % 40 % 50 % 60 %

                                                                                * The sum exceeds 100%, since up to three options were allowed

   Source: Bauman Innovation and OPORA – Russian Innovation Survey 2009-2010

   Source: Prazdnichnykh & Liuhto, PEI 2010
Russia’s innovation / R&D activity today (6)

        Figure 6

      Obstacles to innovation

    Main obstacles to innovation activities for mid-sized and large
                                                                                                      Rankings of obstacles to innovation for EU- companies
                        companies in Russia

        Lack of funds available within the                                                                                                              Non-innovative
                    company                                                   62% *              Innovative companies*
                                                                                                                                                         companies*
      Too large cost of innovation activity                          33%                    1     Lack of funds available within              1     No demand for new products
                                                                                                  the company                                       and services
          Difficult to get external financing                        33%                    2     Difficult to get external                   2     Lack of funds available within
                                                                                                  financing                                         the company
 Uncertainty of demand for a new product
                                                               23%                                Uncertainty of demand for a                       Difficult to get external
                 or service                                                                 3                                                 3
                                                                                                  new product or service                            financing
       Lack of qualified human resources                   19%
                                                                                            4     Difficult to find suppliers                 4     Difficult to find suppliers
           Lack of technology information                12%
                                                                                            5     Too large cost of innovation                5     Uncertainty of demand for a
               Lack of market information            8%                                           activity                                          new product or service
                                                                                            6     Lack of qualified human                     6     Too large cost of innovation
                  Difficult to find suppliers       6%                                            resources                                         activity
        Restricting standards and industry                                                  7     No demand for new products                  7     Restricting standards and
                    regulations                     6%
                                                                                                  and services                                      industry regulations
        No demand for new products and
                   services                         5%                                      8     Restricting standards and                   8     Lack of qualified human
                                                                                                  industry regulations                              resources
       Ineffective innovation management            5%                                            Lack of market information                        Lack of technology information
                                                                                            9                                                 9
     Board of Directors doesn't recognize
            innovation as priority                 4%
                                                                                            10    Lack of technology information             10     Lack of market information
                                                0% 10% 20% 30% 40% 50% 60% 70%
* The sum exceeds 100%, since up to three options were allowed                               * See Community Innovation Survey 2004-2006 for explanations

          Source: Prazdnichnykh & Liuhto, PEI 2010
          Source: Bauman Innovation and OPORA – Russian Innovation Survey 2009-2010; Community Innovation Survey 2004-2006, Central Statistics Office
Russia’s innovation / R&D activity today (7)

Figure 7

Barriers to innovation: human resources and education

   Availability of engineers and technicians               8%           21%             18%         23%          17%         10% 3%
                                                         Low                                                                      High

    Cost to hire engineers and technicians              2% 8%        12%                32%           20%        14%          13%
                                                         Too high, inacceptable                                              Acceptable

  Education quality in vocational schools and              8%         17%               26%           25%          16%         6% 2%
              technical colleges                         Low                                                                       High

     Quality of higher education in natural              4%     13%               18%         24%          18%         19%         4%
          sciences and engineering                       Low                                                                      High

   Quality of math and science education in               6%     11%         14%          24%             23%          18%        5%
                    school                               Low                                                                       High

 Source: Prazdnichnykh & Liuhto, PEI 2010
 Source: Bauman Innovation and OPORA – Russian Innovation Survey 2009-2010
Russia’s innovation / R&D activity today (8)

Figure 8

Intellectual property protection

   Intellectual property protection in general                       31%                   24%          14%    14%         10% 4%3%
                                                          Weak                                                                   Strong

        Intellectual property protection:
                                                                 21%            15%         18%          24%         13%     7% 3%
      patents for invention and prototypes
                                                          Weak                                                                   Strong

        Intellectual property protection:                                                                            18%
                                                           8%      10%        16%           22%          18%                      7%
             registered trademarks
                                                          Weak                                                                   Strong

        Intellectual property protection:
                                                             13%          18%             19%           27%          12%     10% 2%
                 authors’ rights
                                                          Weak                                                                   Strong

        Intellectual property protection:
        business secrets and know-how
                                                             12%        11%         18%           27%          13%         13%     4%
                                                          Weak                                                                   Strong

  Source: Prazdnichnykh & Liuhto, PEI 2010
  Source: Bauman Innovation and OPORA – Russian Innovation Survey 2009-2010
Russia’s innovation / R&D activity today (9)

                       Finland is R&D superpower in industrial cooperation with Russia
         Figure 10

        Cooperation with foreign companies in area of technology and innovation

Technological cooperation with partners                                                                                Location of main technology
                                                                      Areas of cooperation
   abroad (during last three years)                                                                                              partners

                                                                                                                                Germany                   36%**
                                                      Upgrading products and                                       *
                                                                                                             53%                    USA             23%
                                                             services
                                                                                                                                   China          16%
                                                                                                                            CIS countries      10%
                                                           Developing new
                                                        products and services
                                                                                                      43%                         Finland     9%
                                      Yes
        No                                                                                                                           Italy    8%
                                          48%
                                                                                                                                   Japan      8%
        49%                                                 Designing and
                                                          implementing new                            42%                         France     5%
                                                         production processes
                                                                                                                                    India    5%
                                                                                                                                 Sweden      5%
                                                         Upgrading production
                                                              processes                               42%                   Other Europe        14%
                                                                                                                        Other non-Europe     5%
                                                                    * The sum exceeds 100%, since multiple                  ** The sum exceeds 100%, since up
                                                                    options were allowed                                    to two options were allowed

             Source: Prazdnichnykh & Liuhto, PEI 2010
             Source: Bauman Innovation and OPORA – Russian Innovation Survey 2009-2010
Finnish-Russian innovation cooperation:
                    Some examples
INTER-ENTERPRISE JOINT INNOVATION ACTIVITY
* Flagship: Nokia in Skolkovo

INNOVATION FINANCE
* TEKES-FASIE
* Rusnano-Finnish Industry Investment Ltd

NETWORKING
* FinNode Russia (match making)
* Technopolis (technopark)
* Finnish-Russian Innovation Centre (regional cooperation)

PR- ACTIVITIES
* EU-Russia Innovation Forum (mainly bilateral annual event - third time in June 2011)

JOINT RESEARCH
* Academy of Finland and the Russian Foundation for Humanities (2006-2009)
* Various universities and their Russia-units

EXCHANGE OF RESEARCHERS
* Various universities
Some policy considerations based on
           Finnish-Russian cooperation (1)
(1) Establish a Joint EU-Russia Innovation Centre both in Russia
and in the EU.

(2) Support the internationalization of innovations.

(3) Turn the innovations conducted in the military sector into
civilian use.

(4) Improve intellectual property rights (IPR) and the investment
climate.

(5) Institutional innovations are needed.

(6) Design a service innovation policy.
Some policy considerations based on
            Finnish-Russian cooperation (2)

( 7) Enhance management innovations.

( 8) Create innovation competition.

( 9) Establish innovation journalism to share best practices.

(10) Do not concentrate on radical innovations.

(11) Teach creativity and entrepreneurship in universities.

(12) Avoid political stagnation.
From Phileas Fogg to Yuri Gagarin –
                 but what after Gagarin ?

Epilogue:

              50 years ago, the Soviet cosmonaut, Yuri Gagarin,
                 flew around the world in less than two hours.

            Lesson: reaching “the impossible” is possible but
      it takes time and requires foreign cooperation / competition.
You can also read