Ultra High Field (7 Tesla) MRI for Musculoskeletal Applications
←
→
Page content transcription
If your browser does not render page correctly, please read the page content below
Technology Image Gallery

Ultra High Field (7 Tesla)
MRI for Musculoskeletal
Applications
Siegfried Trattnig; Štefan Zbýň; Vladimir Juras; Pavol Szomolanyi; Stephan Domayer;
Iris-Melanie Noebauer-Huhmann; Goetz Welsch; Benjamin Schmitt

MR Centre - High field MR, Department of Radiology, Medical University of Vienna/Vienna General Hospital,
Vienna, Austria

                                          Since the end of the 1990s, high field         Due to the relatively small volumes of
                                          MRI operating at 3 Tesla has become the        joints in comparison to brain or abdo-
                                          benchmark for routine clinical applica-        men for example, a higher B0 and B1
                                          tions, as well as for clinical MRI research.   homogeneity is easier to study in mus-
                                          The clinical benefits of the double sig-       culoskeletal applications. While in mor-
                                          nal-to-noise ratio (SNR) compared to           phological imaging the spatial resolution
                                          standard 1.5 Tesla MRI lie predominantly       can be increased within the same scan
                                          in the possibility of combining morpho-        time compared to 3 Tesla, compositional
                                          logical and functional high-field MR           or biochemical MR of cartilage and other
                                          methods, such as functional MR, meta-          joint structures benefit from the higher
                                          bolic imaging, and diffusion-weighted          SNR at 7 Tesla. Moreover, nuclei other
                                          imaging.                                       than protons can be used at 7 Tesla.
                                          In the early 2000s, the MRI field strength     Sodium values which correlate directly
                                          was again increased by another factor          with the glycosaminoglycan content of
                                          of approximately two and at least three        cartilage, as well as other MSK struc-
                                          major MR vendors currently provide             tures such as the tendons and the inter-
                                          commercial 7 Tesla systems for human           vertebral disc, have been used in clinical
                                          clinical research under approved ethical       applications for the first time [1]. The
                                          permission. During the last several            same is true for Chemical Exchange
                                          years, the number of 7 Tesla installa-         Saturation Transfer (CEST), which is a
                                          tions finalized or under preparation has       very modern glycosaminoglycan
                                          increased to about 50.                         (GAG)-specific technique [2]. This image
                                          While clinical MR research centers oper-       gallery gives an overview of musculo-
                                          ating at 7 Tesla mostly focus on neuro-        skeletal applications at 7 Tesla.
                                          logical applications, only a few 7 Tesla
                                                                                         CAUTION: The 7T system is an investigational device.
                                          sites perform whole-body clinical
                                                                                         Limited by U.S. federal law to investigational use.
                                          research. This is because of the limited       The products mentioned herein are still under develop-
                                          availability of suitable coils for 7 Tesla,    ment and not commercially available yet. Its future
                                                                                         availability cannot be ensured.
                                          which have to be transmit and receive
                                                                                         This research system is not cleared, approved or
                                          coils, and because of the higher B1 het-       licensed in any jurisdiction for patient examinations.
                                          erogeneity related to the ultra high field.    This research system is not labelled according to
                                                                                         applicable medical device law and therefore may only
                                          Other limitations relate to the safety         be used for volunteer or patient examinations in the
                                          issues, particularly the increased specific    context of clinical studies according to applicable law.
                                          absorption rate (SAR).

98 MAGNETOM Flash · 2/2012 · www.siemens.com/magnetom-world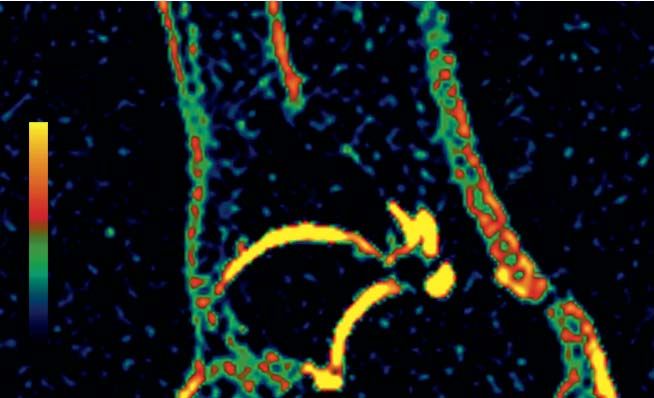
Image Gallery Technology

1A                                           1B                                           1C
              PD TSE 3T                                 PD TSE 7T Quick                            PD TSE 7T High Res.

Case 1
Coronal fat-saturated (fs) 2D proton density-weighted turbo spin echo (PD TSE) sequence
for 3T (1A), 7T quick (same resolution compared to 3T, but shorter scan time at 7T) (1B) and
7T high-resolution (same scan time compared to 3T, but higher resolution at 7T) (1C)
measurements. The medial femoral condyle with the medial meniscus is enlarged for better
visualisation of the image quality.

1D                                           1E                                           1F
              PD SPACE 3T                                PD SPACE 7T Quick                       PD SPACE 7T High Res.

The sagittal fat-saturated isotropic 3D PD-TSE sequence, called PD SPACE (sampling
perfection with application-optimised contrasts using different flip angle evolutions),
is shown for the 3T and two 7T protocols (see above).

                                                                     MAGNETOM Flash · 2/2012 · www.siemens.com/magnetom-world   99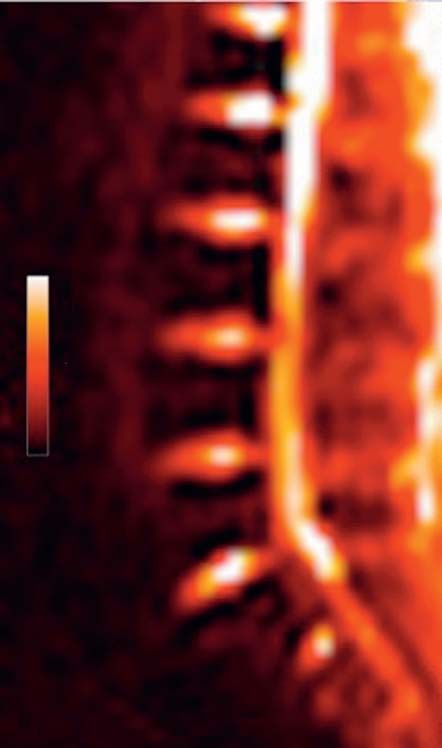
Technology Image Gallery

        2A                                                         2B

        2C                                                         2D

        Case 2
        Sagittal 2D SE of the healthy ankle of a 25-year-old volunteer at 3T (2A) and 7T (2B).
        Coronal 2D TSE of the healthy ankle of a 25-year-old volunteer at 3T (2C) and at 7T (2D).

100 MAGNETOM Flash · 2/2012 · www.siemens.com/magnetom-world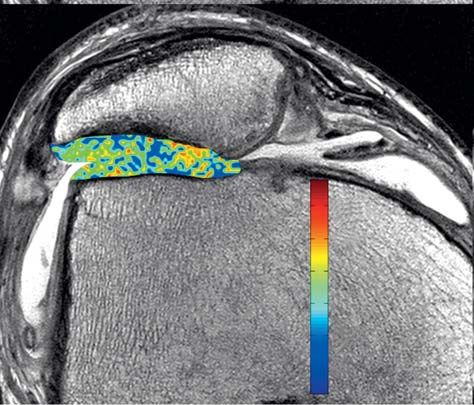
Image Gallery Technology

3A                                           3B                                               3C

Case 3
PD fs grayscale image of the wrist (3A), T1-weighted wrist image (3B) and image of fingers,
showing cartilage of small joints (3C).

4A                                                 4B   100                                           Case 4

                                                                                                      Sagittal knee image of
                                                                                                      a 58-year-old male atient,
                                                        50                                            9.4 years after Autologous
                                                                                                      Osteochondral Transplan-
                                                                                                      tation (AOT) at the medial
                                                                                                      femoral condyle.
                                                        0                                             (4A) Morphologic PD-TSE
                                                                                                      image. (4B) Graphical
                                                                                                      overlay with T2-map.
                                                                                                      Colorbar represents relax-
                                                                                                      ation times in [ms]; higher
                                                                                                      values = more water,
                                                                                                      disturbed collagen archi-
4C                                                 4D                                                 tecture. (4C) Graphical
     25                                                 18
     20                                                                                               overlay with gagCEST
                                                                                                      image. Colorbar repre-
     15                                                 16
                                                                                                      sents gagCEST asymme-
     10
                                                                                                      tries in [%]; lower values,
     5                                                  14                                            less PG content. (4D)
     0                                                                                                Graphical overlay with
     -5                                                 12                                            Sodium image. Colorbar
                                                                                                      represents the Sodium
                                                                                                      SNR values; lower values,
                                                                                                      less PG content. Note,
                                                                                                      that with all modalities
                                                                                                      degenerative changes are
                                                                                                      seen in the area of AOT.

                                                                  MAGNETOM Flash · 2/2012 · www.siemens.com/magnetom-world   101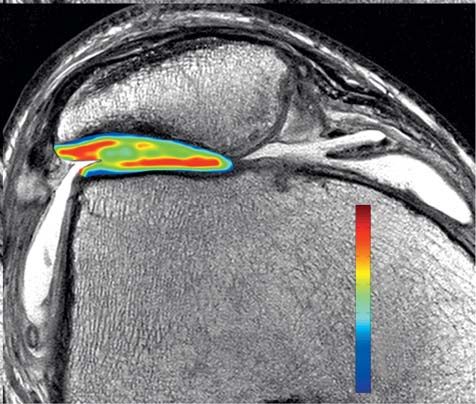
Technology Image Gallery
5A 5B
AT L 100 ms
0 ms
5C 5D
12.5
490
10
460
7.5
430
5
400
2.5 370
0 340
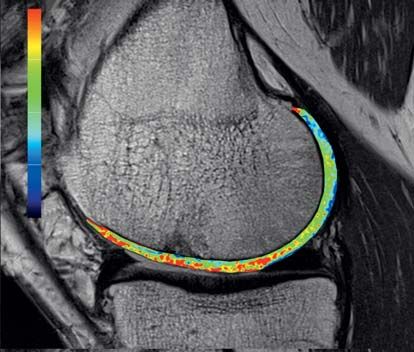
Case 5
Axial knee images from a 25-year-old male patient after matrix-associated chondrocyte
transplantation (MACT) in the retropatellar cartilage (L). Cartilage adjacent to the lesion (AT)
appears morphologically intact on PD-TSE image (5A) and appears normal on the color-coded
overlay of T2-map (5B). However on color-coded overlay of gagCEST (5C) and color-coded
overlay of Sodium image (5D) lower values in adjacent cartilage is seen, corresponding to a
lower GAG content.
102 MAGNETOM Flash · 2/2012 · www.siemens.com/magnetom-world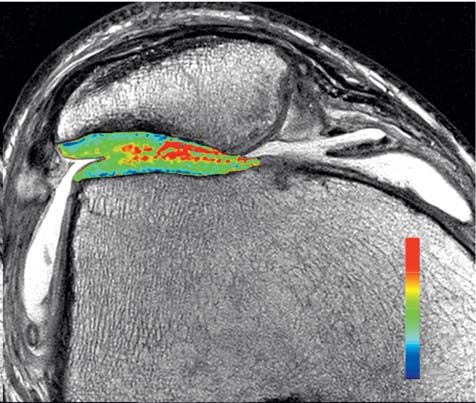
Image Gallery Technology

6A

 80

 40

     0
         ms

6B

                                  2
                                               Case 6
                                               T2-mapping of the ankle
 80
                                               joint cartilage layer at
                                               7T (6A). In (6B) the
                            1
                                               regions-of-interest for
                                               the zonal analysis are
                                               superimposed onto the
 40                                            cartilage layer of the
                                               talus.

     0
         ms

              MAGNETOM Flash · 2/2012 · www.siemens.com/magnetom-world   103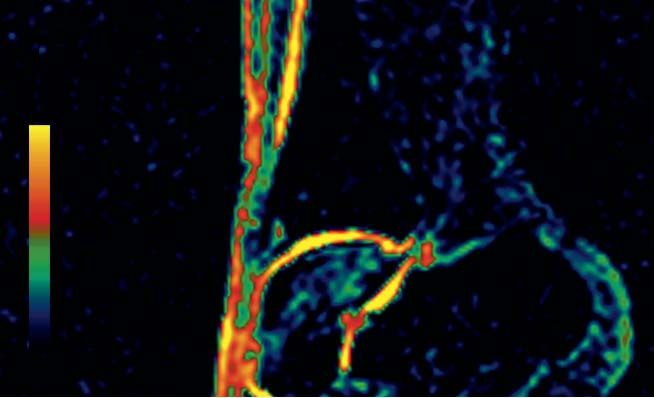
Technology Image Gallery

7A                                                                    7B

                                                                           1392

                                                                           0

7C                                                                    7D

                                                                           1408

                                                                           0

     Case 7
     The comparison of the sodium signal in a healthy volunteer (7B) and in a patient
     with Achilles tendinopathy (7D). Corresponding morphological images are on
     the left-hand side, 7A and 7C respectively. Higher sodium image intensity (white
     arrows) in case of the patient with chronic Achilles tendinopathy corresponds to
     the higher GAG content found in such patients (7D) in comparison to healthy
     tendons (7B).

     104 MAGNETOM Flash · 2/2012 · www.siemens.com/magnetom-world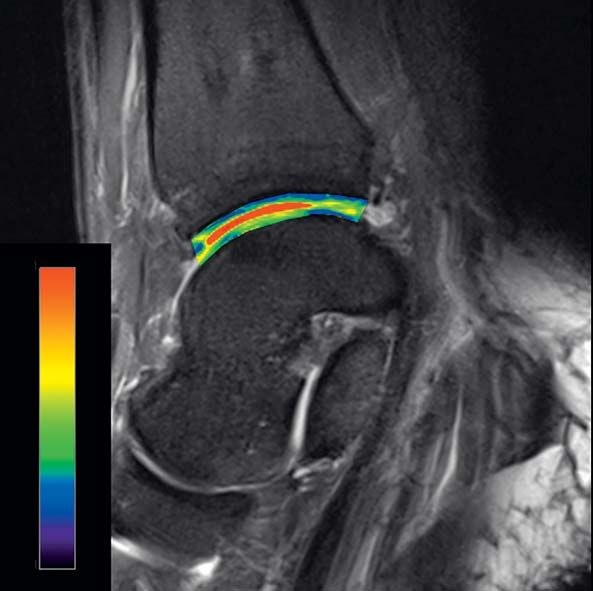
Image Gallery Technology
8A 8B
514 214
259 P 128 P
4
42
7T MRI Na+ imaging 3T MRI T2 Mapping
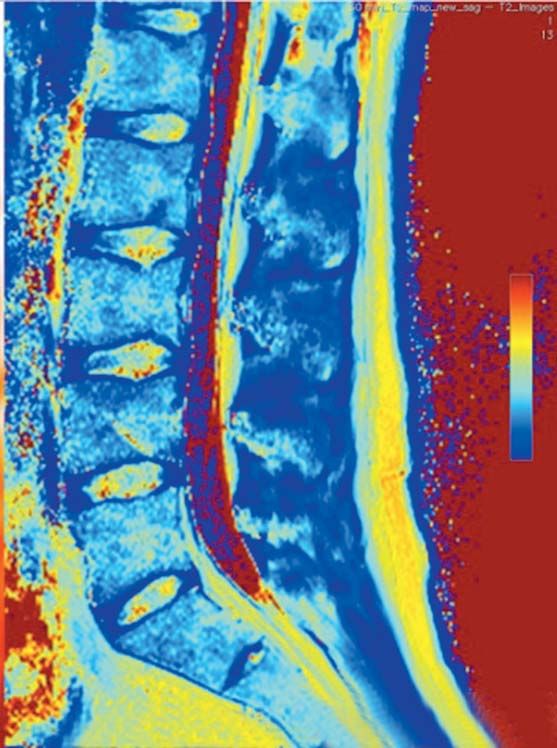
Case 8
7T Sodium imaging (8A) and 3T color-coded image of T2-mapping
(8B) in a volunteer without disc degeneration.
References
1 Juras V, Zbyn S, Pressl C, et al (2012) Regional Variations Contact
of T2* in Healthy and Pathologic Achilles Tendon In Vivo Prof. Siegfried Trattnig, M.D.
at 7 Tesla: Preliminary Results. Magnetic Resonance in MR Center – High field MR
Medicine, In Press. Department of Radiology
2 Schmitt B, Zbyn S, Stelzeneder D, et al (2011) Cartilage Medical University of Vienna/Vienna
quality assessment by using glycosaminoglycan chemical General Hospital
exchange saturation transfer and (23)Na MR imaging at Lazarettgasse 14
7T. Radiology 260, 257-64 DOI: 10.1148/radiol.11101841. A-1090 Vienna
Austria
Phone: +43 1 40 400 6460
Fax.: +43 1 40 400 6475
siegfried.trattnig@meduniwien.ac.at
MAGNETOM Flash · 2/2012 · www.siemens.com/magnetom-world 105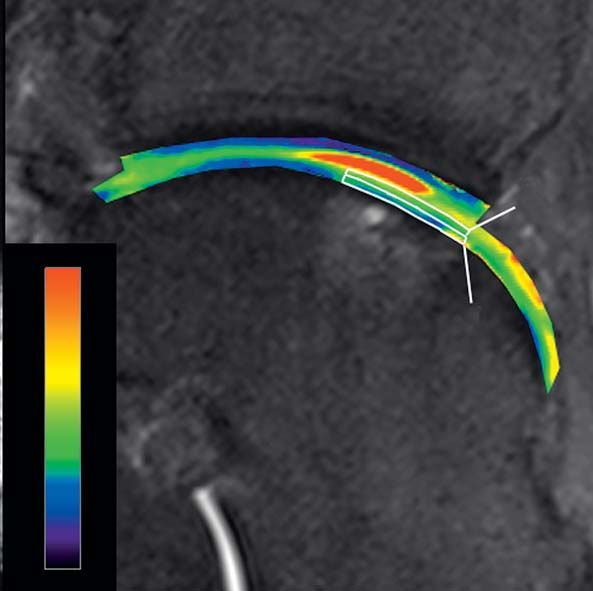
You can also read