North American Commission - NAC(18)09 Presentation of the ICES Advice for the North American stocks to the Commission
←
→
Page content transcription
If your browser does not render page correctly, please read the page content below
North American Commission

              NAC(18)09

 Presentation of the ICES Advice for the
North American stocks to the Commission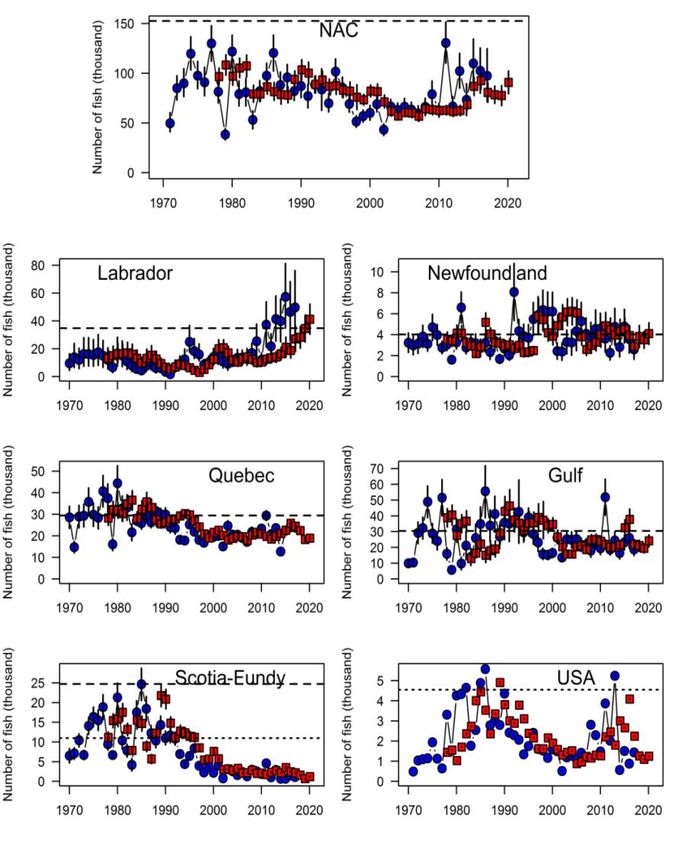
sal.21.nac
Atlantic salmon from North America
Terms of Reference
3. With respect to Atlantic salmon in the North American Commission area:
3.1 describe the key events of the 2017 fisheries (including the fishery at St Pierre and
Miquelon);
3.2 update age-specific stock conservation limits based on new information as available,
including updating the time-series of the number of river stocks with established CLs by
jurisdiction;
3.3 describe the status of the stocks, including updating the time-series of trends in the
number of river stocks meeting CLs by jurisdiction;
3.4 provide catch options or alternative management advice for 2018-2021 with an assessment
of risks relative to the objective of exceeding stock conservation limits, or pre-defined NASCO
Management Objectives, and advise on the implications of these options for stock rebuilding;
and
3.5 update the Framework of Indicators used to identify any significant change in the previously
provided multi-annual management advice.
3.1 Key Events 2017 Fisheries: Catch
                                                           Reported                    Unreported
• Canada:                                                  112 t (8% coastal)              25 t
• Saint Pierre and Miquelon (France):                        3 t (100% coastal)             -
• USA:                                                       0t                             0t
Sal.21.nac: Table 1
                                                  Canada
                                                                                       St Pierre &
                                                                                                                    North
                                     Indigenous    Labrador                            Miquelon          USA
                        Commercial                              Recreational   Total                               America
                                        (FSC)      Resident                               (SPM)

 2017 reported
                            0                61             2             49     112                 3         0        115
 harvests (t)
 % of NAC total             -                53             1             43      98                 2         0        100
 Unreported catch (t)                                                             25            na             0         25
 Location of catches
 % in-river                                                                       62             0             -         61
 % in estuaries                                                                   30             0             -         29
 % coastal                                                                         8           100             -         10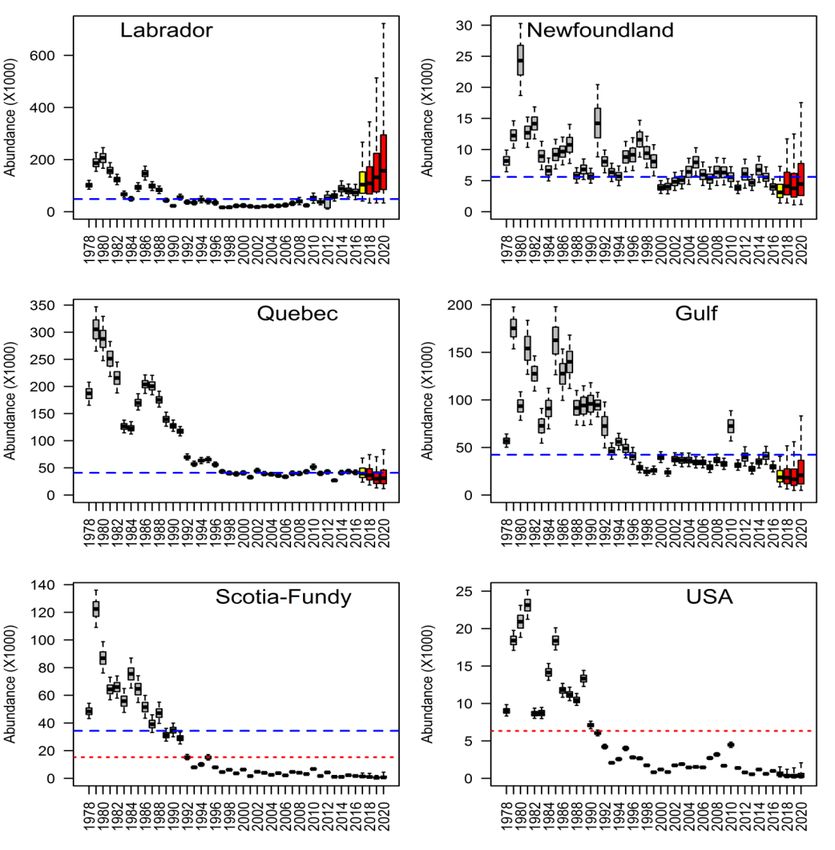
3.1 Key Events 2017 Fisheries: Canada
• Total Catch (harvest; t) Canada 1960-2017
  (sal.21.nac: Figure 1)
                                                                                                                                                               • Exploitation Rates 1971-2017
                      • 112 t: 32 439 small (55 t) and 11 578 large (57 t)                                                                                       (sal.21.nac: Figure 3)
                                                                                                                                                                  • currently lowest in time period
                                     Small salmon tons          Large salmon tons            Total tons          Total number
                      3,500                                                                                                      700

                      3,000                                                                                                      600

                                                                                                                                       Total number (X 1000)
                      2,500                                                                                                      500
  Nominal catch (t)

                      2,000                                                                                                      400

                      1,500                                                                                                      300

                      1,000                                                                                                      200

                       500                                                                                                       100

                         0                                                                                                       0
                              1960

                                        1965

                                               1970

                                                         1975

                                                                1980

                                                                       1985

                                                                               1990

                                                                                      1995

                                                                                                  2000

                                                                                                          2005

                                                                                                                  2010

                                                                                                                          2015

• Recreational Fisheries (49 t, 43% Total Catch)
                      • Recreational Harvest: 24 987 salmon
                      • Catch and Release: 49 513 salmon (67% Recreational Catch)
3.1 Key Events 2017 Fisheries:
Saint Pierre & Miquelon (SPM)
• Saint Pierre and Miquelon catches increased over time
• 2017 reported catch of 3 t less than previous 5 year mean of 4.2 t (2012-2016)
                                         6

                                         5
                     Nominal Catch (t)

                                         4

                                         3

                                         2

                                         1

                                         0
                                          1980   1985   1990   1995   2000   2005   2010   2015   2020

                                                                      Year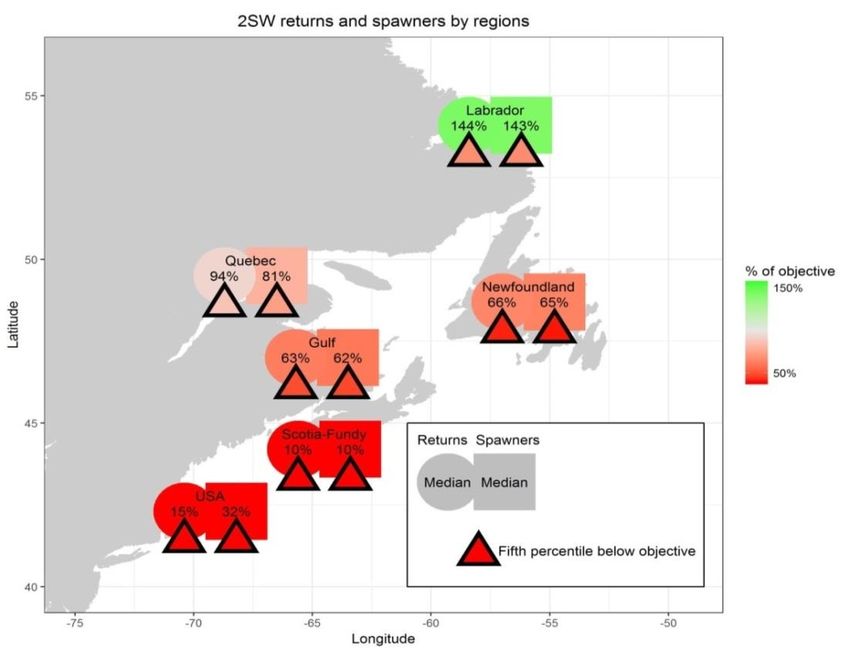
3.1 Key Events 2017 Fisheries:
Origin and Composition of Catches

Labrador Subsistence Fisheries (sal.21.nac: Figure 5)
   • 2015 to 2017: 1486 samples (3% to 5% of harvest)
   • 98.9% Labrador origin (LAB)
   • 2017: 2 of 180 samples assigned to the USA                              100
                                                                                                   2015    2016       2017
     (estimated harvest of 41 salmon)                                         80

                                                        Percent of samples
                                                                              60
   • No USA salmon 2012 to 2016 analyses
                                                                              40
   • 4 USA were reported between 2006 to 2011                                 20

                                                                               0
                                                                                   UNG LAB QLS NFL AVA ANT QUE GAS GUL NOS FUN USA

                                                                                                     Regional group
3.1 Key Events 2017 Fisheries:
Origin and Composition of Catches
Saint Pierre and Miquelon Fishery (sal.21.nac: Figure 6)
    •   2015 to 2017: 398 samples
    •   Samples dominated by small salmon (< 63 cm)
    •   83-89% assigned to 3 reporting regions
        •   Southern Gulf of St. Lawrence (GUL)
        •   Gaspe Peninsula (GAS)
        •   Newfoundland (NFL)
    •   2013 and 2014 dominated by large salmon
    •   Increase in small salmon samples in most recent years
        corresponds to an increase in Newfoundland assignment
•   No information on size of salmon (e.g. proportion small and
    large) in the total harvest to determine if tissue samples
    representative of the catch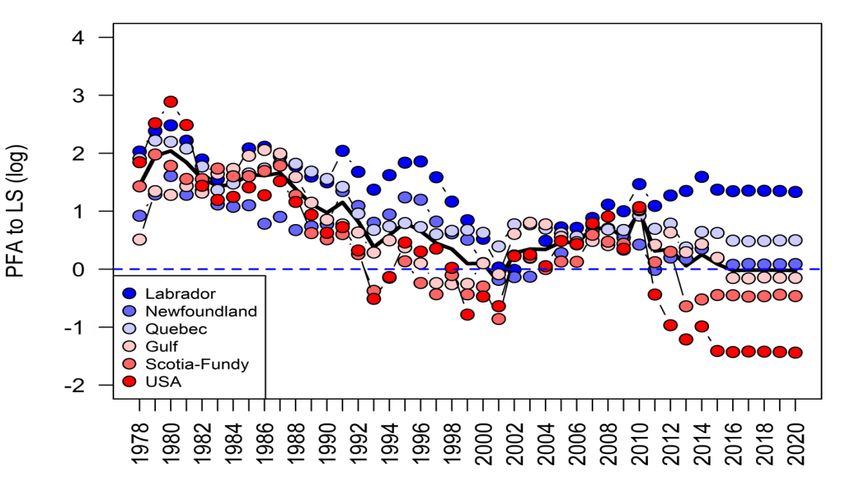
3.2 Stock Conservation Limits (CLs)
• sal.21.nac: Table 3, Figure 7
        Number of Rivers
            Canada
            1991 – 74
            1997 – 266
            2014-2017 – 476
            USA
            Since 1995 – 33
                   Country            Assessment regional       2SW conservation limit    Management objective
             and Commission Area             group                 (number of fish)         (number of fish)
                                                     Labrador                    34 746
                                             Newfoundland                         4 022
                                        Gulf of St. Lawrence                     30 430
          Canada
                                                      Quebec                     29 446
                                                Scotia-Fundy                     24 705                 10 976
                                                        Total                   123 349
          USA                                                                    29 199                  4 549
          North American Commission                                             152 548
3.3 Status of Stocks
• Six regions and overall for North America (sal.21.nac: Figure 2)
• Size groups:
• small (1SW)
• large (MSW and repeat spawners)
• 2SW salmon (a subset of large)
• Returns: include fish caught by homewater commercial fisheries,
except Newfoundland and Labrador
• Pre-fishery abundance (PFA; recruitment):
• Non-maturing 1SW salmon on August 1st of the second summer
at sea (i.e. destined 2SW returns)
• Accounts for returns to rivers, fisheries at sea in North America,
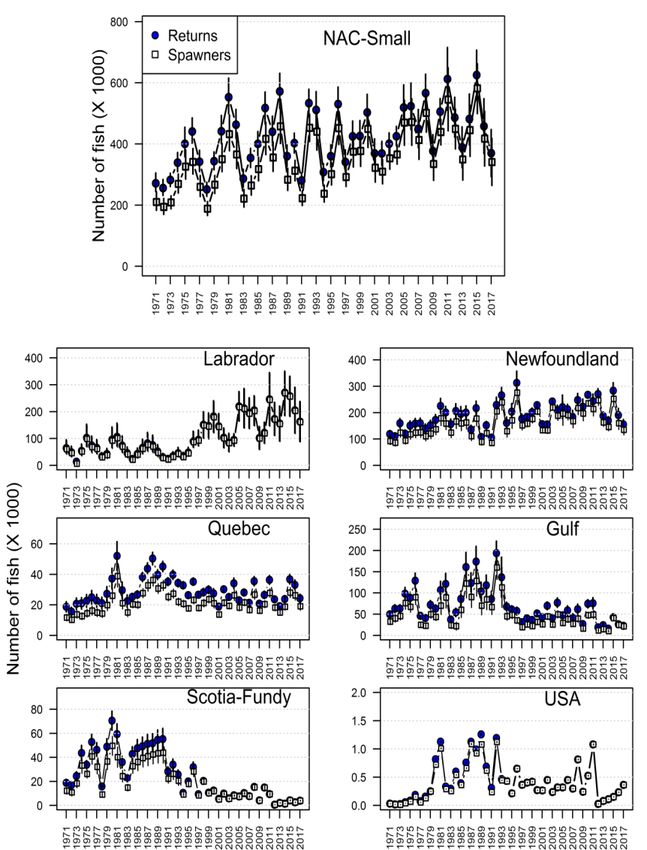
fisheries at West Greenland, and natural mortality3.3 Status of Stocks: Small Returns
• Small salmon returns to North America in 2017
(sal.21.nac: Figure 8)
• 370 000 small salmon
• 19% lower than 2016
• lower range of the 48 year time series
• four of the six geographical regions declined
from 2016
• Labrador and Newfoundland combined
represent 86% of the 2017 total small salmon
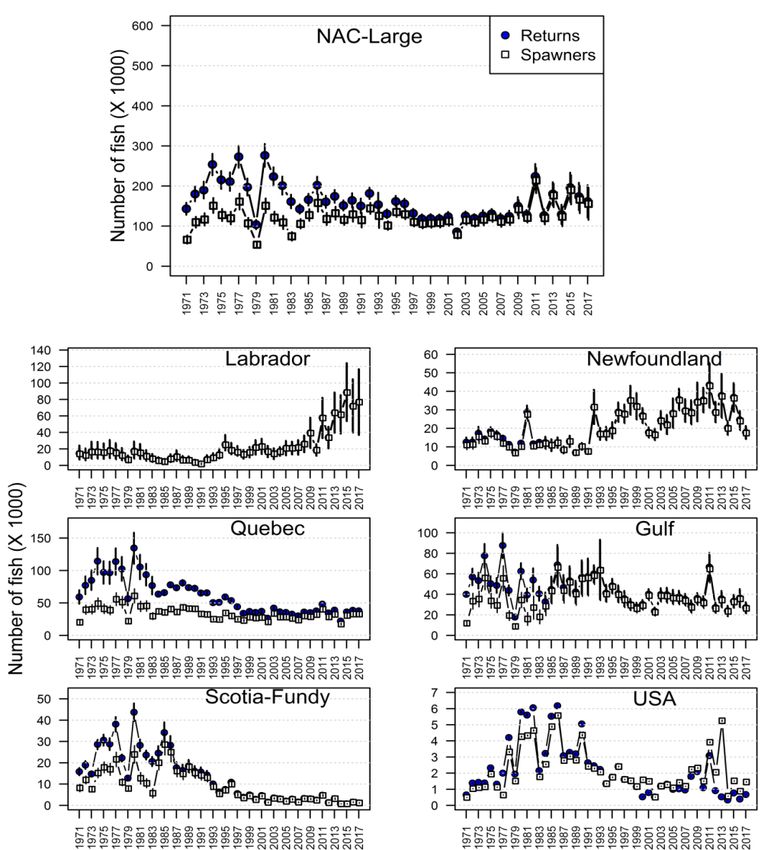
returns to North America3.3 Status of Stocks: Large Returns
• Large salmon returns to North America in 2017
(sal.21.nac: Figure 9)
• 161 500 large salmon
• 7% lower than 2016
• mid-range of the 48 year time series
• four of the six geographical regions
declined from 2016
• Labrador, Québec and Gulf combined
represent 88% of the 2017 total large
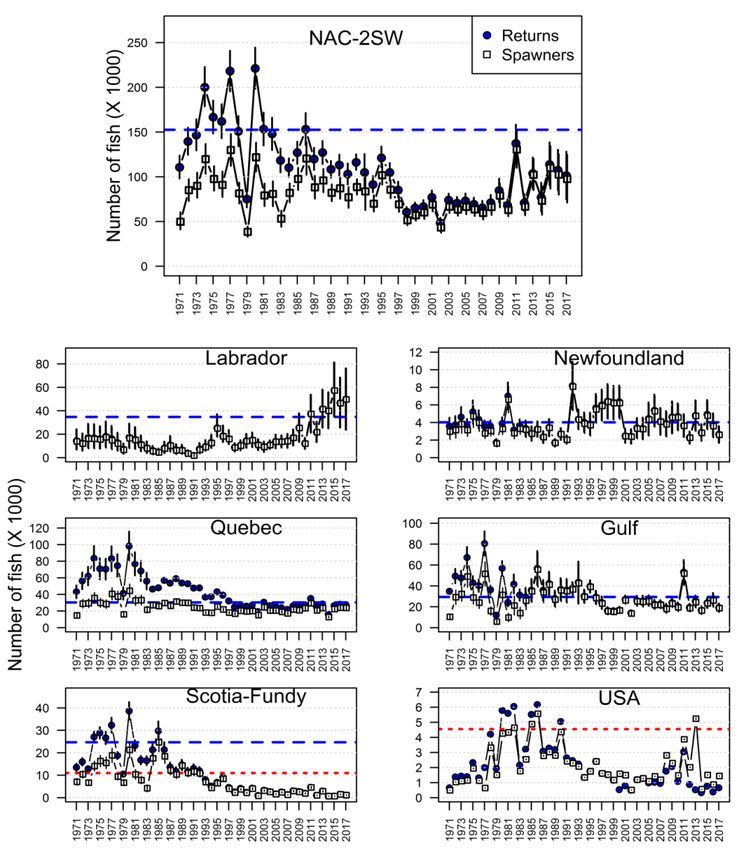
salmon returns to North America3.3 Status of Stocks: 2SW Returns
• 2SW salmon returns to North America in 2017
(sal.21.nac: Figure 10)
• 101 350 2SW salmon
• 6% lower than 2016
• four of the six geographical regions
declined from 2016
• among lowest on record with the exception
of Labrador
• Labrador, Québec and Gulf combined
represent 96% of the 2017 total 2SW
salmon returns to North America3.3 Status of Stocks: Reference Points
Risk Assessment Framework
• Full Reproductive Capacity :
• lower bound of the 90% confidence interval of the estimate above reference point
• equivalent to a probability of at least 95% of meeting reference point
• At Risk of Suffering Reduced Reproductive Capacity:
• lower bound of the confidence interval is below reference point, but the midpoint is above
• Suffering Reduced Reproductive Capacity:
• midpoint is below reference point3.3 Status of Stocks: Pre-Fishery Abundance (PFA) • Number of 1SW salmon on 1 August of the second summer at sea (sal.21.nac: Figure 11) • 1 SW non-maturing • 1SW maturing • Estimates of recruitment (PFA) suggest continued low abundance of North American salmon (suffering reduced reproductive capacity) • Recruitment of the 1SW cohort for the 2016 PFA 2SW CL (SER) year was 638 250 fish; abundance declined by 63% over the time-series from peak in 1975 of 1 705 000 fish.
3.3 Status of Stocks: By Region
• sal.21.nac: Figure 12
• 2017, 2SW median estimates of returns to
  rivers and spawners below CLs for all
  regions except Labrador, and are therefore
  suffering reduced reproductive capacity
• Labrador at risk of suffering reduced
  reproductive capacity
• Particularly large deficits relative to CLs and
  rebuilding/management objectives are
  noted for Scotia-Fundy and USA regions
         Full                   Risk suffering           Suffering
   > 100 reproductive   > 100   reduced          < 100   reduced
          capacity              reproductive             reproductive
                                 capacity                 capacity
3.3 Status of Stocks:
Proportion CL Attained
55
• sal.21.nac: Figure 13
• Egg depositions for 84 rivers in 2017
50
• 42 of 84 (50%) achieved or exceeded CLs
Latitude ºN
• 30 rivers achieved less than 50% CL
• Canada
• rivers assessed annually ranged from 61 to 91
45
• annual percentages of these rivers achieving CL
prop. not met
ranged from 26% to 67% (62% in 2017)
• no temporal trend (sal.21.nac: Figure 7) prop. met
40
• USA
-70 -65 -60 -55 -50
• None of the assessed rivers achieve CLs Longitude ºW3.3 Status of Stocks: Summary • Despite major management changes and increasingly more restrictive fisheries, returns have remained near historical lows, except for returns to Labrador and Newfoundland • All salmon populations within the USA and the Scotia-Fundy regions have been or are being considered for listing under country specific species at risk legislation • Factors other than fisheries constraining production • Declines in smolt production in some rivers of eastern Canada may also be contributing to lower adult abundance
3.4 Catch Options:
Multi-Year Catch Agreement 2015-2018

• NASCO 2015 multi-year regulatory agreement for the West Greenland salmon fishery
  (http://www.nasco.int/pdf/2015%20papers/WGC_15_21.pdf)
• 2018 is the third year and final year of this agreement
• A full assessment of stock status and catch advice was conducted to inform a potential
  new multi-year agreement
3.4 Forecast and Catch Options
• Catch options for mixed-stock fisheries 2018-2021
  provided for non‐maturing 1SW and maturing 2SW
   •   Maturing 1SW not fished outside homewaters

• 2SW Spawners and Lagged Spawners
   •   sal.21.nac: Figure 14
   •   2SW Spawners (blue circle) – year of spawning
   •   2SW and Lagged Spawners (red square) – year of PFA

                                       CL
                                       Management Objective
3.4 Catch Options
• Productivity coefficient (log of PFA to LS) 1978-2020 - sal.21.nac: Figure 15
• negative productivity parameters (log scale) indicate that PFA is less than lagged spawners
• salmon abundances in these regions are expected to continue to decline
PFA:LS
~12:1
~ 7:1
~ 3:1
1:1
~ 0.5:1
~ 0.3:13.4 Catch Options: 2SW PFA
2SW PFA 2017-2020:
(sal.21.nac: Figure 16)
• Labrador – at risk of suffering reduced
reproductive capacity
• All other regions suffering reduced
reproductive capacity
CL (SER)
Management Objective3.4 Catch Options
• All regions have less than 95% probability of achieving 2SW objective
(CL or Management Objective)
• Probability of simultaneous attainment in any year is 0%
• Therefore, no mixed-stock fishery options on 1SW non-maturing salmon in
the period 2018 to 2020 or 2SW salmon in the period 2018 to 2021
sal.21.nac: Table 4
Probability of meeting the 2SW objectives
Region Region specific 2SW objective in the absence of fisheries for the 2SW return year
2018 2019 2020 2021
Labrador 34 746 0.826 0.871 0.888 0.898
Newfoundland 4 022 0.100 0.308 0.289 0.392
Quebec 29 446 0.391 0.387 0.271 0.316
Gulf 30 430 0.033 0.087 0.102 0.194
Scotia-Fundy 10 976 0.000 0.001 0.000 0.003
USA 4 549 0.000 0.001 0.002 0.006
Simultaneous to North America 0.000 0.000 0.000 0.0003.5 Framework of Indicators (FWI)
• FWI used in support of multi-annual catch options in the North American Commission
and West Greenland Commissionwas updated in 2018
• 21 indicator variables (e.g. marine survival and return rates)
• 13 rivers
• No indicator variables were retained for the Labrador or Newfoundland
• FWI can be applied for the next two years, in January 2019 and 2020, based on new
assessment data in 2018 and 2019 (e.g. survival rate, returns) to evaluate the
appropriateness of the adviceRelevant data deficiencies, monitoring needs, and
research requirements
• Complete and timely reporting of catch and effort data from all fisheries of eastern Canada
• Improved sampling of the Labrador and Saint Pierre and Miquelon fisheries
• throughout the fishing season and in all areas to ensure representative of the entire catch
• Additional monitoring be considered in Labrador to estimate stock status for that region
• Efforts should also be undertaken to evaluate the utility of other data sources (e.g. Indigenous and
recreational catches and effort) to describe stock status in Labrador
(Full list in sal.oth.nasco: Section 1.5)You can also read