MONITORING TESTBED EXPERIMENTS WITH PROMETHEUS - Reading Course in Advanced Performance Monitoring and Profiling of Cloud Computing Applications
←
→
Page content transcription
If your browser does not render page correctly, please read the page content below

MONITORING TESTBED
                        EXPERIMENTS
                      WITH PROMETHEUS
                  Reading Course in Advanced Performance
                      Monitoring and Profiling of Cloud
                          Computing Applications

Jakub Krzywda
                                                    Umeå, October 10, 2018
jakub@cs.umu.se
Opening Thought

We are “Distributed System” Research Group…

… so we theoretically should do research on Distributed Systems…

... but who evaluated his/her solution in a real distributed testbed?
ALPACA Testbed Setup
                        Works fine for “static”                    Controller
                        experiments, starts to be                  • Controls experiments
                        complex for more                           • Hosts ALPACA controller
                        “dynamic” ones…                            • Analyses results
Experiment protocol
1. Start monitoring
2. Run workload                                                                 Metrics:
3. Stop monitoring                                                              • Power budget
4. Collect logs (scp)                                                           • Power consumption
5. Analyse (+ align)                   Metrics:                                 • Application config
                                       • Application performance
                                       • Application workload

              Workload Generator
                                                                        Host
              • Sends application requests
                                                                        • Hosts applications
              • Monitors application performance
Experiment protocol
   Power Shepherd Testbed Setup                0. Deploy monitoring framework
                                               1. Save “start” timestamp
                                               2. Run workload – on-line preview
                                               3. Save “end” timestamp
                                               4. Download time series from Prometheus
                                               5. Analyse

Controller
• Controls experiments
• Analyses results

          Workload Generator
          • Sends application requests                    Host
          • Monitors application performance              • Hosts applications
          Cluster Controller                              • ALPACA controllers
• an open-source systems monitoring and alerting toolkit
• originally built at SoundCloud*
• started in 2012, public release in 2015
• has a very active developer and user community
• is now a standalone open source project and maintained
independently of any company
• joined the Cloud Native Computing Foundation in 2016
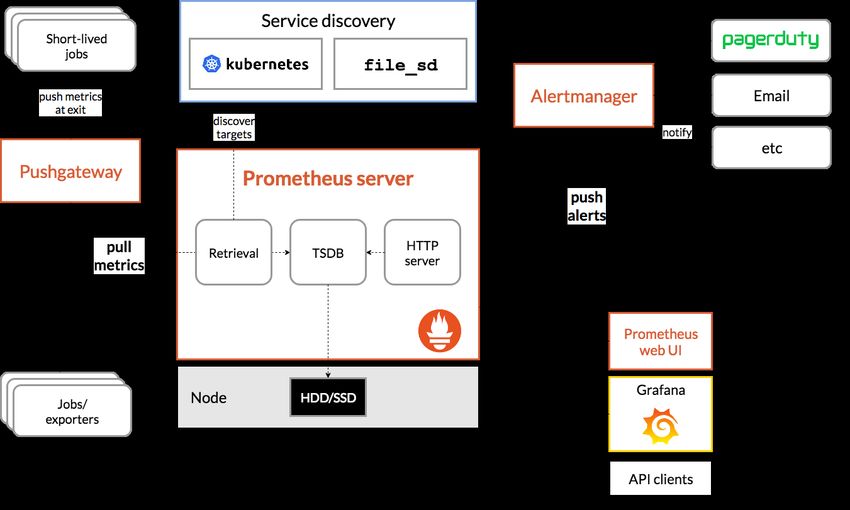
* started by Matt T. Proud before he joined SoundCloudArchitecture
Data Model
• Prometheus fundamentally stores all data as time series
• Metric names and labels
   • Every time series is uniquely identified by its metric name and a set of key-
     value pairs, also known as labels
• Samples
   • Samples form the actual time series data
     Each sample consists of:
      • a float64 value
      • a millisecond-precision timestamp
Metric Types Counter Gauge Histogram Summary * “Currently only differentiated in the client libraries, Prometheus server does not yet make use of the type information and flattens all data into untyped time series. This may change in the future.”
Jobs and Instances
• “Google-like” terminology
• an endpoint you can scrape is called an instance, usually
  corresponding to a single process
• a collection of instances with the same purpose, a process replicated
  for scalability or reliability for example, is called a job
Exposing Metrics to Prometheus
• Third-party exporters (indirect)   • Software exposing Prometheus
   • Databases                         metrics
   • Hardware related – e.g., Node      • Collectd
     exporter                           • Docker Daemon
   • Messaging systems                  • Kubernetes
   • Storage
                                     • Client libraries (direct
   • HTTP – e.g. Apache, HAProxy       instrumentation)
   • APIs
                                        •   Go
   • Logging
                                        •   Java or Scala
   • Other monitoring systems
                                        •   Python
   • Miscellaneous - Xen
                                        •   Ruby
                                        •   and other …
Textfile Collector + cron
data source
(crontab entry)
(bash) script
.prom file
Node exporter
.prom file format:
metric_name {label_name=“label_value”, …} value [timestamp]“The analytics platform for all your metrics
Grafana allows you to query, visualize, alert on
and understand your metrics no matter where
they are stored. Create, explore, and share
dashboards with your team and foster a data
driven culture.”
• hundreds of dashboards and plugins in the
official library
• open source:
https://github.com/grafana/grafana
• Grafana includes built-in support for Prometheus
“They were connecting to Prometheus BEFORE it was cool.”Deployment Options • Deploy directly on your machines • Prometheus • Grafana • Node Exporter • Use Swarmprom - a starter kit for Docker Swarm monitoring • Very easy to deploy • Requires all the machines to be part of Docker Swarm • Still capable of monitoring things outside of Docker • https://github.com/stefanprodan/swarmprom
Exporting Data
• Styx
   •   Export Prometheus data as CSV or directly plot with gnuplot & matplotlib
   •   https://github.com/go-pluto/styx
   •   https://promcon.io/2017-munich/slides/lightning-talks-day1-06.pdf
   •   Didn’t manage to make it work…
• My own script
   • Download data using API (JSONformat)
   • Convert to CSV (using jq - https://stedolan.github.io/jq/)
Alternatives
• Kapacitor + InfluxDB
   • similar scope
   • supports event logging
   • open-core model
• Graphite
   • scope: time series data base
• OpenTSDB
   • a distributed time series database based on Hadoop and HBase
• Nagios
   • primarily about alerting based on the exit codes of scripts

Monitoring Agents Comparative Study
https://wiki.opnfv.org/display/fastpath/Monitoring+Agents+Comparative+Study
Conclusions

• Use monitoring “external” to your solution - Prometheus can help
  with that!

• We can create a common library for monitoring our testbed
  experiments!
You can also read