COVID-19 and the Spatial Legacies of Colonization and American Apartheid
←
→
Page content transcription
If your browser does not render page correctly, please read the page content below
NASEM Roundtable on the Promotion of Health Equity

COVID-19 and the Spatial Legacies of
Colonization and American Apartheid
LAWRENCE BROWN, PHD, DIRECTOR OF COUNTY HEALTH RANKINGS AND ROADMAPS, VISITING PROFESSOR AT THE UNIVERSITY OF WISCONSIN POPULATION HEALTH INSTITUTE
How We Frame & Collect Data Matters
3
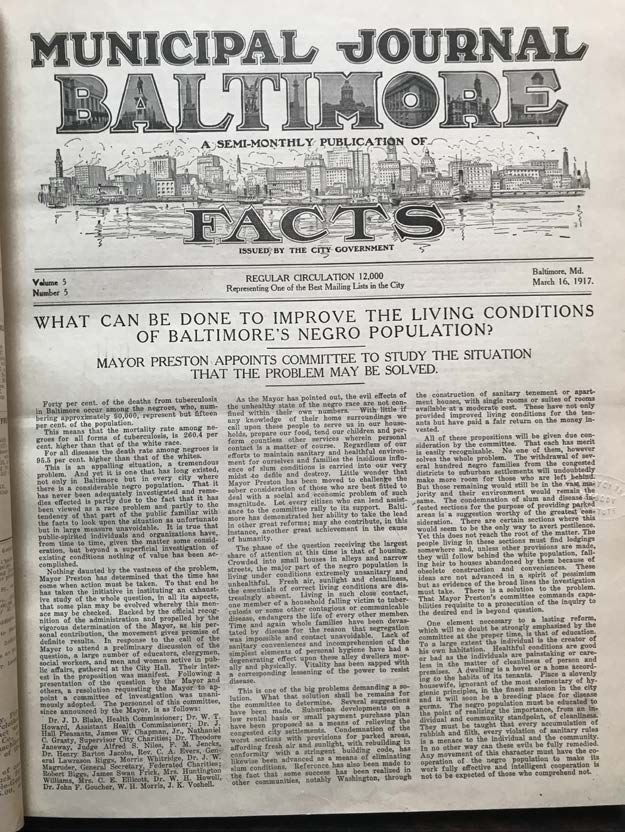
Public Health Data and Baltimore Apartheid

                   BALTIMORE SUN, FEBRUARY 24,
                   1917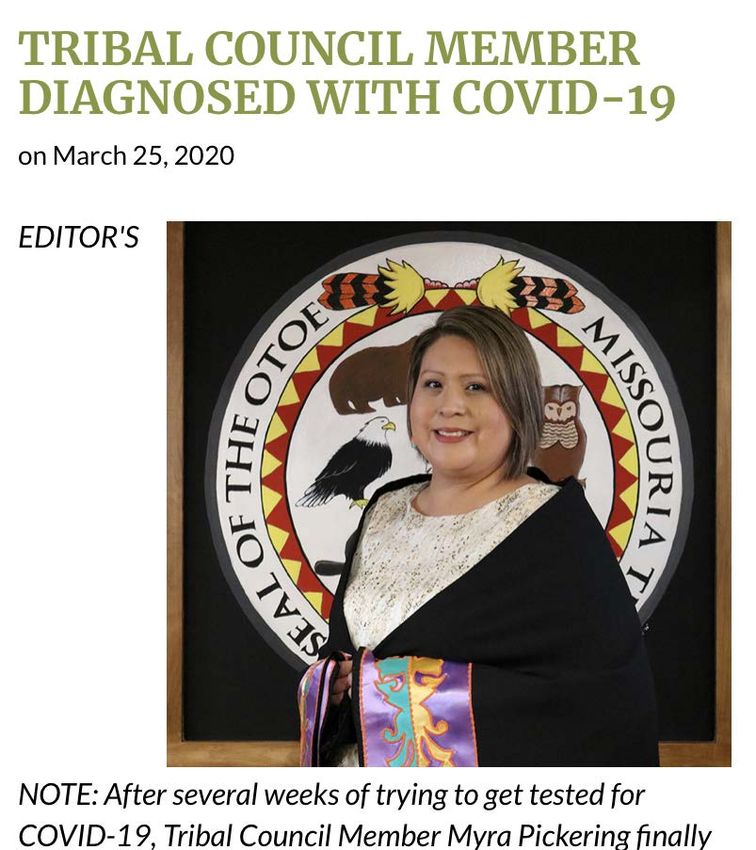
COVID-19 and Racial/Ethnic Disparities
How Much Were People Concerned?
Missing Data
We don’t have data for everyone.
• Latinx
• Asian/Pacific Islander
• Native Americans
• Individuals with disabilities
• LGBTQ
Stories Matter
COVID-19
Testing
Delayed...
             •   MYRA PICKERING IS A TRIBAL MEMBER OF THE OTOE-MISSOURIA IN OKLAHOMA.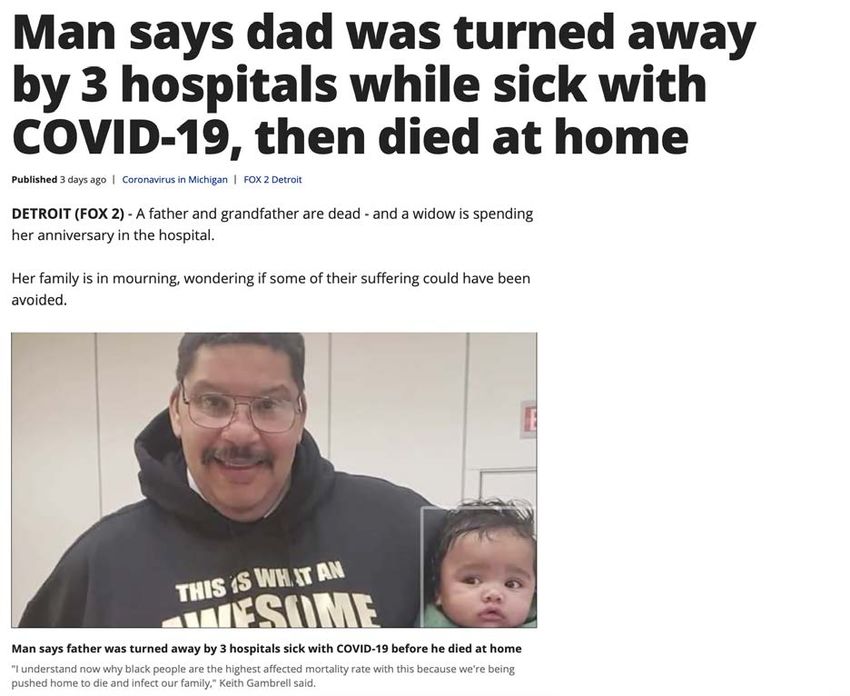
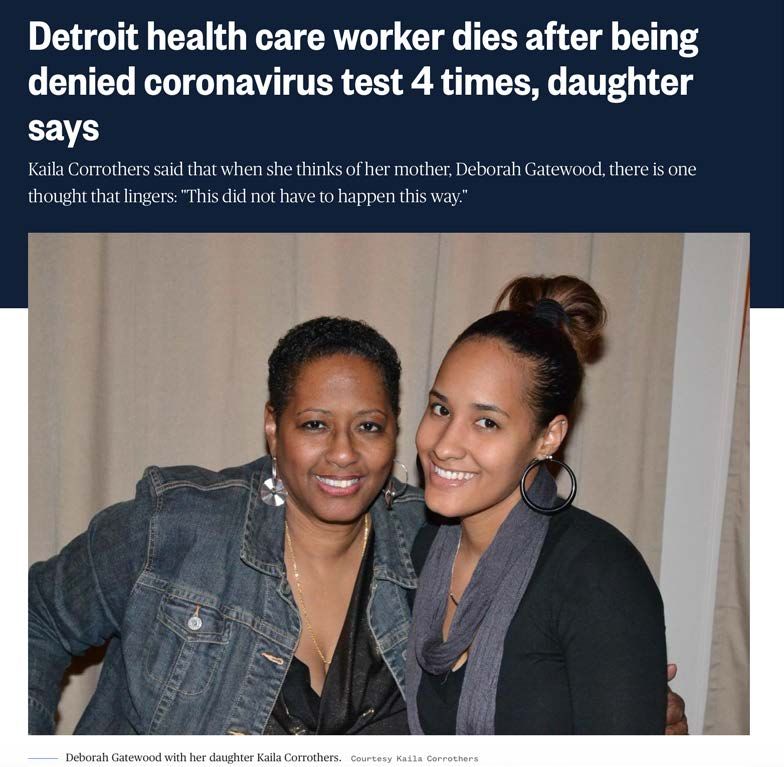
...COVID-19 Testing Denied

       G ARY FO W LER        DEBORAH GATEWOOD
Racial Bias in Testing?
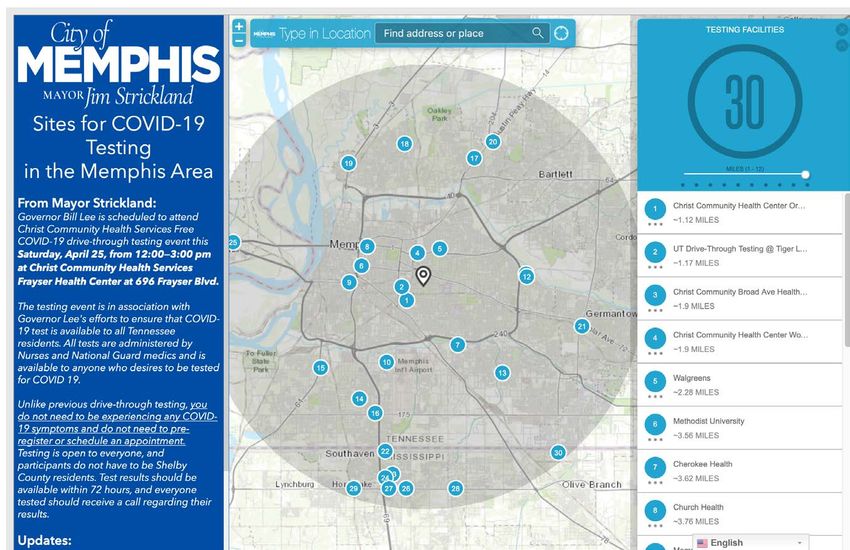
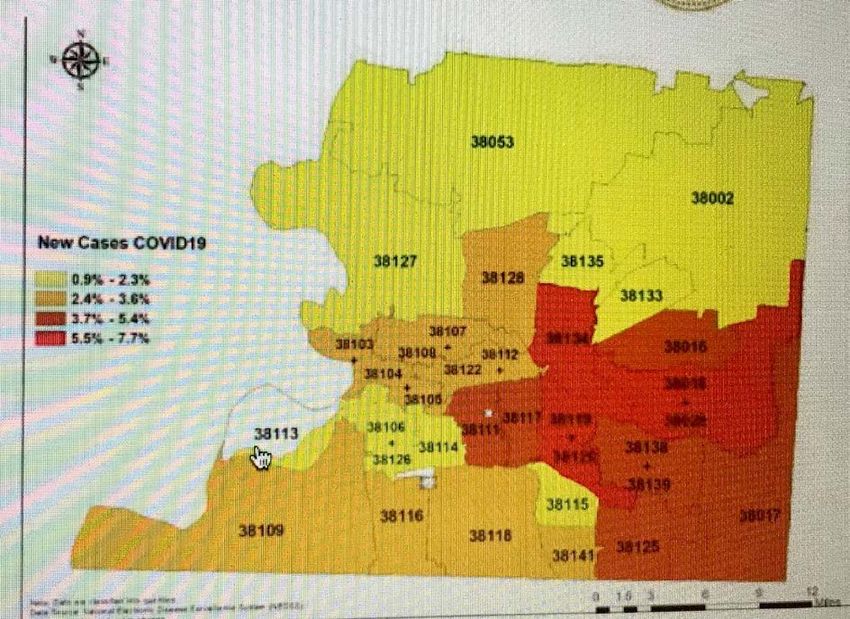
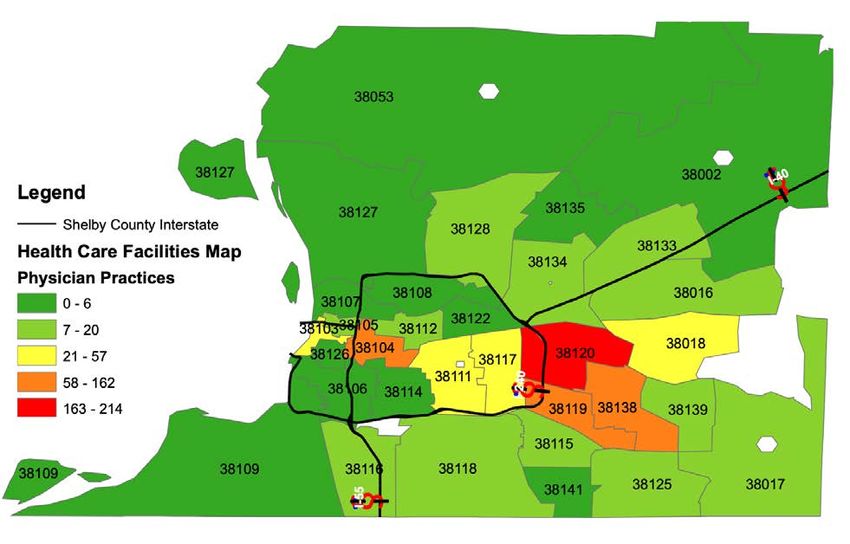
Where Testing Happens Matters
COVID-19 in Shelby County, TN

S T A C Y J A C O B S O N . M A R C H 2 7 , 2 0 0 0 . M A P O F S H E L B Y C O U N T Y C O R O N A V I R U S C A S E S H I G H L I G H T S A R E A S L A C K I N G T E S T I N G . W REG.
COVID-19 Testing Sites in Shelby County, TN
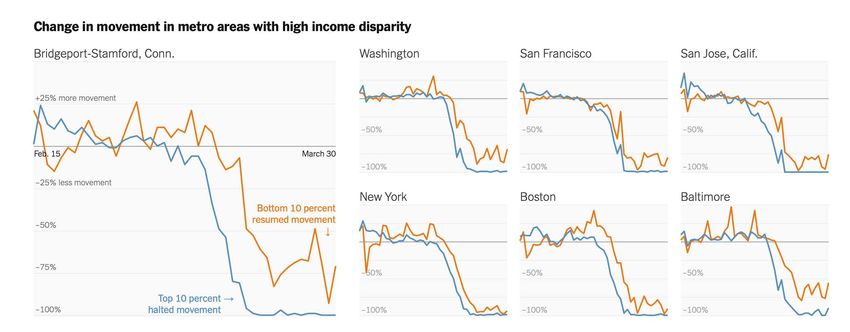
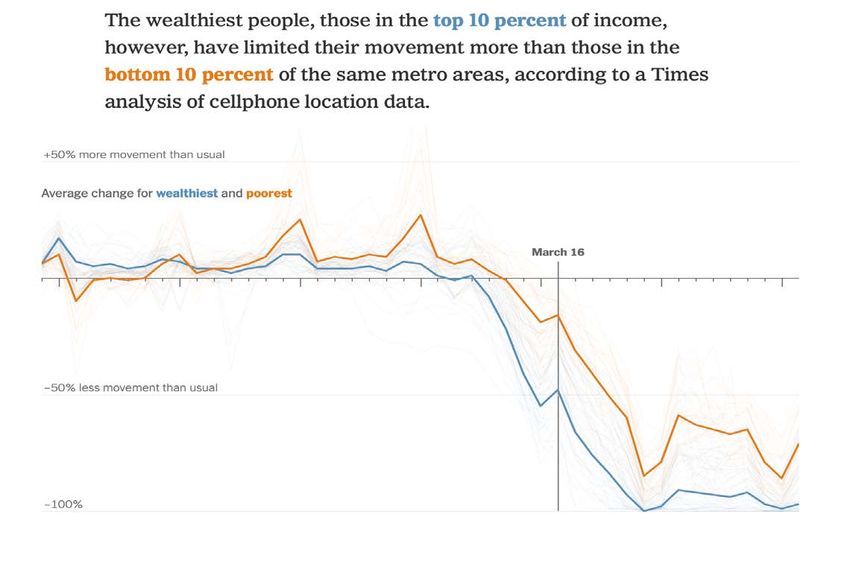
Location Data Says It All: Staying at Home During Coronavirus
Is a Luxury (New York Times, April 3, 2020)
Location Data Says It All: Staying at Home During Coronavirus Is a
Luxury (New York Times, April 3, 2020)
Space is the Place: COVID-19 Data
Three Waves of COVID-19
• Wave 1: Seattle, California, nursing homes,
  cruise ships
• Wave 2: Large urban areas (especially New
  York City & adjacent areas, New Orleans)
• Wave 3: Rural areas, Tribal Lands, Deep South
Hypersegregation in America

D O U G L A S S M A S S E Y A N D J O N AT H A N TA N N E N . 2 0 1 5 . A R E S E A R C H N O T E O N T R E N D S I N B L A C K H Y P E R S E G R E G AT I O N . D E M O G R A P H Y. V O L . 5 2 ( 3 ) : 1 0 2 5 -
1034.
COVID-19 in Hypersegregated Cities
                         Cities         Segregation Intensity        Hypersegregation Status         Cases per 100,000

                     New York City            Category 4           Currently hypersegregated               1,873.4

                     New Orleans              Category 3              Once hypersegregated                 1,613.3

                      Albany, GA              Category 2              Once hypersegregated                  1,609

                        Detroit               Category 5           Currently hypersegregated                874.7

                      Philadelphia            Category 4           Currently hypersegregated                666.9

                        Chicago               Category 5           Currently hypersegregated                528.7

                    Washington DC             Category 3              Once hypersegregated                  515.4

                      Indianapolis            Category 3              Once hypersegregated                  480.3

                          Flint               Category 5           Currently hypersegregated                350.3

                        Denver                Category 2              Once hypersegregated                  343.9

COVID-19 DATA FROM APRIL 24, 2020. OBTAINED FROM THE U.S. COVID-19 ATLAS. UNIVERSITY OF CHICAGO CENTER FOR SPATIAL DATA SCIENCE.
The Damage of Racial Segregation • Fewer health care facilities in urban areas (Ko et al, 2013) and rural areas (Caldwell et al., 2017) • Food apartheid and increased obesity (Goodman et al, 2018; Reese, 2019) • Higher rates of heart disease and stroke (Greer et al., 2013*), blood pressure (Kershaw et al., 2017) • Worse outcomes in child/youth health (Kotecki et al., 2018*) • Medical apartheid (White-Means et al, 2009; Washington, 2007; Boyd 2019) • Increased air pollution (Woo et al, 2019; Grove et al, 2017) • The historical underdevelopment of Black neighborhoods and under-resourcing of public goods in highly segregated cities (Trounstine, 2018) • Hyperpolicing both in terms of more fatal police shootings (Siegel et al, 2019) and more excessive force complaints (Smith and Holmes, 2014) • Overall (Hicken et al., 2019) EMPIRICAL FINDINGS HIGHLIGHT HOW RACIAL SEGREGATION HURTS WHITE PEOPLE WHO LIVE IN HIGHLY SEGREGATED CITIES.
Measuring Neighborhoods' Changes in Mobility, in Respon
to Coronavirus (Jamie Saxon)
Historical Trauma in America

HISTORICAL TRAUMA THEORY WAS FIRST POSED BY MARIA YELLOW HORSE BRAVEHEART. THIS MODEL WAS DEVELOPED BY MICHELLE SOTERO.
COVID-19 in Tribal Lands
                                                                                  Percentage Native
                                                            Native American                                  Cases per
                                           Counties                                  American in
                                                             Tribal Groups                                    100,000
                                                                                       County

                                      McKinley County,        Navajo, Hopi,
                                                                                          73.3                 877.2
                                       New Mexico               and Zuni

                                       Navajo County,
                                                              Navajo, Hopi                43.2                 563.3
                                          Arizona

                                                      White Mountain
                                       Apache County,
                                                      Apache, Navajo,                     72.8                 413.9
                                          Arizona
                                                           et al.

C O V I D - 1 9 D ATA F R O M A P R I L 2 4 , 2 0 2 0 . O BTA I N E D F R O M T H E U. S . C O V I D - 1 9 AT L A S . UNIVERSITY OF CHICAGO CENTER FOR SPATIAL DATA
SCIENCE.
COVID-19 in State Correctional Institutions
Institution racial
Counties Institution Name Cases per 100,000
demographics
54% White,
Lincoln County,
The Cummins Unit 42% Black 5,162.5
Arkansas
(statewide)
Bledsoe County 58% White,
Bledsoe County,
Correctional 40% Black 4,006.3
Tennessee
Complex (statewide)
Marion Almost half
Marion County,
Correctional White and half 3,319.4
Ohio
Institution Black
Pickaway
Pickaway County, 60% White,
Correctional 2,889.2
Ohio 38% Black
Institution
COVID-19 DATA FROM APRIL 24, 2020. OBTAINED FROM THE U.S. COVID-19 ATLAS. UNIVERSITY OF CHICAGO CENTER FOR SPATIAL
DATA SCIENCE.Solutions • Spatially contextualize COVID-19 data. By only highlighting COVID-19 inequities by race and ethnicity, we obscure the spatial legacies of colonization and American Apartheid. We’re setting people up for COVID-19 stigmatization and demonization by not going to the root. • Decolonize and desegregate. COVID-19 is exposing the spatial legacies of colonization and American Apartheid. To heal from ongoing historical trauma, America must go to the root and repair the damage. • Pursue de-carceration. We need to address crime and violence from a structural level, not just at the individual level. COVID-19 is revealing that overcrowded prisons and mass incarceration are bad for public health. • Budget to support life. In FY2019, America allocated $686.1 billion to the Department of Defense and $90 billion to the Department of Health and Human Services. In FY2018, Baltimore City allocated over $471.9 million to the Baltimore Police Department from the General Fund while allocating only $40.8 million to the Baltimore City Health Department. We can’t have healthy populations with apartheid budgets.
You can also read