Epidemiology of COVID-19 in Children and Teens - CDC Coronavirus Disease 2019 Response
←
→
Page content transcription
If your browser does not render page correctly, please read the page content below
CDC Coronavirus Disease 2019 Response

Epidemiology of
COVID-19 in Children
and Teens

Angela Campbell, MD, MPH, FPIDS, FIDSA
Virtual ACIP Emergency Meeting
January 27, 2021

                                         For more information: www.cdc.gov/COVID19
Outline
Overview of U.S. COVID-19
Epidemiology
Epidemiology of COVID-19 in Children and Teens
Multisystem Inflammatory Syndrome in Children (MIS-C)
2
Overview of U.S. COVID-19 Epidemiology
Trends in Number of COVID-19 Cases in the United States
January 22, 2020, to January 24, 2021

                              350000

                              300000
   Number of COVID-19 Cases

                              250000

                              200000

                              150000

                              100000

                               50000

                                   0
                                 Jan 22 2020 Mar 7 2020 Apr 21 2020 Jun 5 2020   Jul 20 2020 Sep 3 2020 Oct 18 2020 Dec 2 2020 Jan 16 2021

                                                                                       https://www.cdc.gov/covid-data-tracker/index.html#trends   4
Trends in Number of COVID-19 Deaths in the United States
January 22, 2020, to January 24, 2021
                                7000

                                6000
    Number of COVID-19 Deaths

                                5000

                                4000

                                3000

                                2000

                                1000

                                   0
                                 Jan 22 2020   Mar 7 2020   Apr 21 2020   Jun 5 2020   Jul 20 2020    Sep 3 2020   Oct 18 2020    Dec 2 2020   Jan 16 2021

                                                                                                     https://www.cdc.gov/covid-data-tracker/index.html#trends   5
Epidemiology of COVID-19 in Children
and Teens
COVID-19 Reported Incidence by Age Group: Lowest in
Children
Estimated SARS-CoV-2 Infection Rates per 100,000
Population Adjusting for Under Detection
                               35,000

                                                               30,602
                               30,000
                                                  27,218
  Infection rate per 100,000

                               25,000
                                                                                  22,966

                               20,000
                                                                                                    16,722
                                        15,333
                               15,000

                               10,000

                                5,000

                                   0
                                        0-4 yrs   5-17 yrs    18-49 yrs          50-64 yrs         >=65 yrs

                                                             Age group
                                                                                                                                           8
                                                                     https://www.cdc.gov/coronavirus/2019-ncov/cases-updates/burden.html
Estimated SARS-CoV-2 Seroprevalence in Children
Estimated SARS-CoV-2 Seroprevalence in Children
Estimated SARS-CoV-2 Seroprevalence in Children
Estimated SARS-CoV-2 Seroprevalence in Children
Case-Ascertained Household Transmission Study,
Tennessee and Wisconsin,* April–Nov 2020

                                       Short-term follow-up:

                                        Periodic/daily
                                        follow-up and
                                        sample collection

                                                                       = Non-infected
      * Vanderbilt University Medical Center;                          = Infected
        Marshfield Clinic Research Institute
                                                        FLUTES-C Study. Grijalva, et al. MMWR 2020;69(44):1631-34
                                                                                                                    13
Case-Ascertained Household Transmission Study, Tennessee and Wisconsin: Enrolled Participants 147 index cases enrolled, median 3.5 days after onset (IQR: 3–4 days) 306 household contacts enrolled
Younger Children Were Less Likely to Be Symptomatic and
Have Fewer Symptoms than Adults
 100%
Secondary Infection Rates: Symptomatic Children Seem
to Transmit SARS-CoV-2 Less than Adults

                                                                            FLUTES-C Study. Preliminary   16
                       (excluding possible co-primary and tertiary cases)   data, subject to change
Children Exposed in the Household Had Similar Risk of
SARS-CoV-2 Infection as Adults
FLUTES-C Study. Preliminary 17
(excluding possible co-primary and tertiary cases) data, subject to changeSecondary Infection Rates Similar Among Pediatric and Adult
Household Contacts: Utah and Wisconsin, March–May 2020
N = 188
18
Laws RL, et al. Pediatrics. 2020; doi:10.1542/peds.2020-027268Children
Children with Certain Underlying Conditions May Be More
Likely to Have Severe Illness from COVID-19
Asthma or chronic lung disease
Diabetes
Genetic, neurologic, or metabolic
conditions
Sickle cell disease
Heart disease since birth
Immunosuppression
Medical complexity
Obesity
20
https://www.cdc.gov/coronavirus/2019-ncov/daily-life-coping/children/symptoms.html52% of Children
Children
COVID-19 Mortality Rates Are Lowest Among Children
Multisystem Inflammatory Syndrome in
Children (MIS-C)
Multisystem Inflammatory Syndrome in Children April 2020 – Severe inflammatory syndrome recognized in the UK, occurring in children with current or recent infection with SARS-CoV-2 May 2020 – Cases reported in New York City and New York State May 14 – Healthcare providers requested to report patients
https://emergency.cdc.gov/han/2020/han00432.asp https://www.cdc.gov/mis-c/hcp/ 26
Three classes Class 1 (n=203), “typical” MIS-C
of patients: – 98% serology positive
– 100% cardiovascular and 98% GI manifestations
– Markedly elevated laboratory markers of inflammation
– 84% ICU admission
Class 2 (n=169), acute COVID-19/MIS-C combo
– 100% RT-PCR positive, 16% serology positive
– More respiratory involvement
– 62% ICU admission
Class 3 (n=198), milder illness
– Younger, median age 6 years
– Higher frequency of rash, mucocutaneous lesions
– 97% serology positive, 36% RT-PCR; 44% ICU admission
27
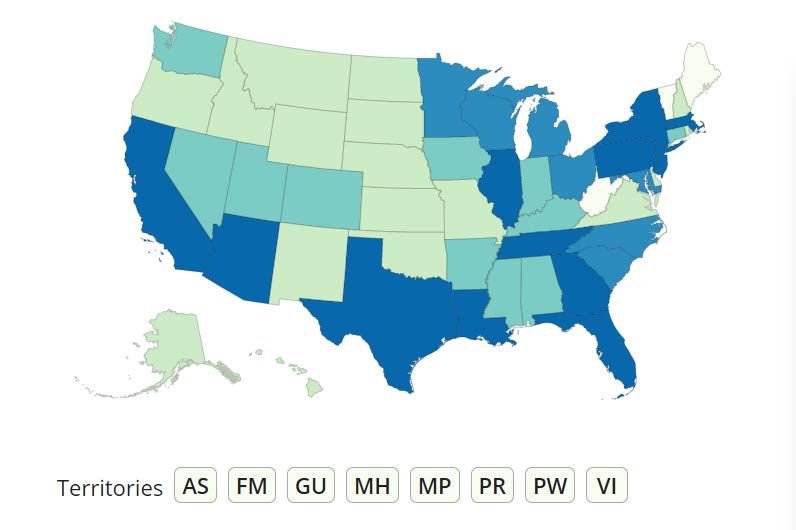
Godfred-Cato, et al. MMWR 3030;69:1074-80Health Department-Reported Cases of Multisystem
Inflammatory Syndrome in Children (MIS-C)
1,659 cases February 19 – December 29, 2020
26 deaths
47 states, New York City,
and Washington, DC,
have reported >1 case
Average age 8 years
57% male
33% Hispanic/Latino;
30% Black, non-Hispanic
https://www.cdc.gov/mis-c/cases/index.html; last updated January 8, 2021 28Daily MIS-C Cases, March–December 2020
N=1659; Gray area on right represents most recent 6 weeks of data, for which case reports are likely incomplete.
https://www.cdc.gov/mis-c/cases/index.html; last updated January 8, 2021 29Estimated Incidence of MIS-C Cases, 7 Jurisdictions, April–June 2020 Population-based incidence estimates (denominator was population of persons
Summary
Summary As of January 24, >24 million cases of COVID-19 and >410,000 COVID-19- associated deaths were reported in the United States. Children
For more information, contact CDC
1-800-CDC-INFO (232-4636)
TTY: 1-888-232-6348 www.cdc.gov

The findings and conclusions in this report are those of the authors and do not necessarily represent the
official position of the Centers for Disease Control and Prevention.
You can also read