The Large Hadron Collider
←
→
Page content transcription
If your browser does not render page correctly, please read the page content below
Chapter 2
The Large Hadron Collider
This chapter provides a brief introduction to the Large Hadron Collider (LHC). More information
about the design, construction and operation of the LHC can be found in References [1, 2, 3].
The remainder of the chapter is organized as follows: Section 2.1 provides an overview of the LHC
and its injection chain. Section 2.2 describes the data sets provided by the LHC for the work in this
thesis.
2.1 Overview
The LHC is a super-conducting accelerator and collider installed in a 27 km long circular tunnel
that is buried 100 m underground. The LHC is located at the European Organization for Nuclear
Research (CERN). It sits across the border of France and Switzerland, near the city of Geneva. A
diagram of the LHC is shown in Figure 2.1. The tunnel was originally constructed between 1984 and
1989 for the CERN LEP machine [4]. The LHC collides protons at four locations along the ring of
the machine, corresponding to the location of the four LHC experiments: ALICE [5], ATLAS [6],
CMS [7], and LHCb [8]. Inside the LHC, beams of protons travel in opposite directions in separate
beam pipes. They are guided around the accelerator ring by a strong magnetic field, achieved with
super-conducting magnets. The LHC is designed to produce collisions with a center of mass energy
√
of s = 14 TeV.
The LHC is only the final stage is a series of machines used to accelerate the protons to increasingly
higher energies. Protons, obtained from hydrogen atoms, begin the chain in a linear accelerator called
Linac2. The Linac2 accelerates the protons to 50 MeV. The protons are then injected in to the
PS Booster, which accelerates them to 1.4 GeV. After the PS Booster, the protons are sent to the
Proton Synchrotron where they are accelerated to 25 GeV. They are then sent to the Super Proton
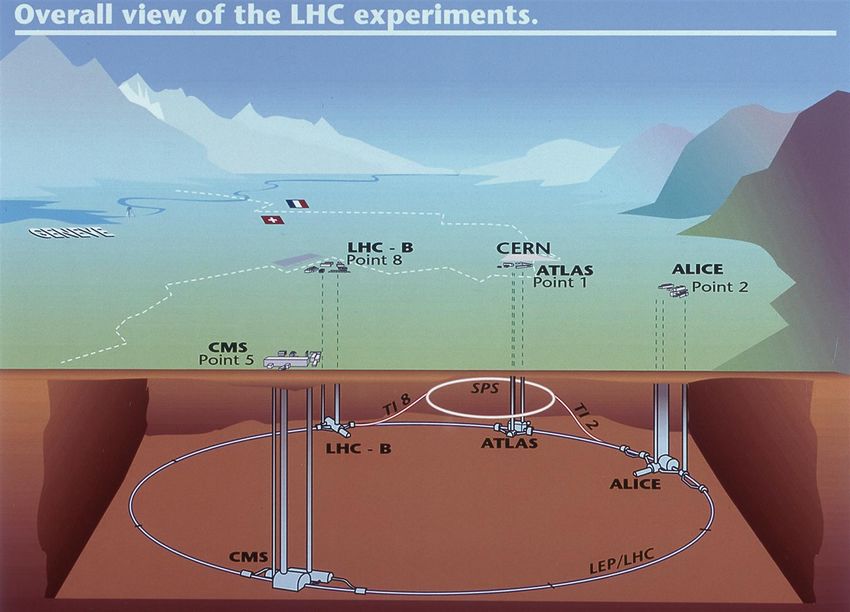
142. The Large Hadron Collider 15 Figure 2.1: Diagram of the locations of the four main experiments (ALICE, ATLAS, CMS and LHCb) at the LHC. Located between 50 m and 150 m underground, huge caverns have been excavated to house the giant detectors. The SPS, the final link in the pre-acceleration chain, and its connection tunnels to the LHC are also shown. Synchrotron (SPS) where they are accelerated to 450 GeV. They are finally injected into the LHC where they are accelerated to their final energy. Under normal operating conditions, the colliding beams will circulate for many hours at a time. As a consequence of the acceleration scheme, the proton beams circulate the ring in bunches. Under nominal operating conditions, each proton beam has 2808 bunches, with each bunch containing about 1011 protons. These bunches are a few centimeters long and about 16 µm wide when they collide. As a result, each bunch crossing produces many pp interactions. The 2012 running had as many as 30 interactions per bunch crossing.
2. The Large Hadron Collider                                                                        16

2.2      The 2010-2012 LHC Data-Sets

From the physics point of view, the most important characteristics of a data-set provided by an
accelerator are the energy and luminosity.
                                       √
   The LHC was designed to produce s = 14 TeV collisions. During the initial turn on, in 2008,
one of the links between super-conducting magnets failed, or “quenched”, leading to an explosion that
damaged several other magnets [9]. The source of the unexpected quench was determined to be a
faulty solder connection. Problematic connections were found and repaired in several other magnets
and additional quench protection was added. Until further repairs could be made it was decided to
run the LHC at a reduced energy. In 2010 and 2011, the LHC was operated at 3.5 TeV per beam,
          √
producing s = 7 TeV collisions. In 2012, the energy was increased to 4 TeV per beam, producing
√
  s = 8 TeV collisions. The LHC will be shut down in 2013-2014 for a series of repairs, after which it
is expected to be run at 6.5-7 TeV per beam.
      The other important characteristic of the LHC data is the luminosity. The luminosity is pro-
portional to the number of collisions produced by the accelerator. The performance is typically
characterized by the “instantaneous” luminosity and the “integrated” luminosity. The instantaneous
luminosity is proportional to the rate of collisions. Figure 2.2 shows the instantaneous luminosity of
the 2010, 2011, and 2012 data sets [10]. The instantaneous luminosity has increased with time and
is nearing the design of 1034 cm−2 s−1 or 10 nb−1 s−1 . The large number of interactions per bunch
crossing is a direct consequence of the conditions required to produce high instantaneous luminosities.
      The integrated luminosity, on the other-hand, is proportional to the total number of collisions
collected. Figure 2.3 shows the integrated luminosity of the 2010, 2011, and 2012 data sets [10]. The
total data set obtained in 2010 was 0.04 fb−1 , compared to 5 fb−1 collected in 2011, and around 30
fb−1 expected by the end of 2012. Large integrated luminosities correspond to large data sets, which
allow for the study of rare processes, such as the production of the Higgs boson. The data sets shown
in Figure 2.3 are the basis of the work presented in this thesis.

2.3      Bibliography

[1]    T. S. Pettersson and P. Lefevre, The Large Hadron Collider: conceptual design., Tech. Rep.
       CERN-AC-95-05 LHC, CERN, Geneva, Oct, 1995. https://cdsweb.cern.ch/record/291782.

[2]    L. Evans and P. Bryant, LHC Machine, JINST 3 (2008) no. 08, S08001.

[3]    T. Linnecar et al., Hardware and Initial Beam Commissioning of the LHC RF Systems.
2. The Large Hadron Collider 17
cm-2 s-1]
10 s = 7 TeV s = 7 TeV s = 8 TeV
ATLAS
Online Luminosity
33
8
Peak Luminosity [10
6
4
2
0
Jan Apr Jul Oct Jan Apr Jul Oct Jan Apr Jul Oct
Month in 2010 Month in 2011 Month in 2012
Figure 2.2: The peak instantaneous luminosity delivered to ATLAS per day versus time during the
pp runs of 2010, 2011 and 2012.
Delivered Luminosity [fb ]
-1
ATLAS Online Luminosity
25 2010 pp s = 7 TeV
2011 pp s = 7 TeV
2012 pp s = 8 TeV
20
15
10
5
0
Jan Apr Jul Oct
Month in Year
Figure 2.3: Cumulative luminosity versus day delivered to ATLAS during stable beams and for pp
collisions. This is shown for 2010 (green), 2011 (red) and 2012 (blue) running. The relative amount
of data accumulated in 2010 is so small that it does not show up on this scale.2. The Large Hadron Collider 18
oai:cds.cern.ch:1176380 , Tech. Rep. LHC-PROJECT-Report-1172.
CERN-LHC-PROJECT-Report-1172, CERN, Geneva, Oct, 2008.
https://cdsweb.cern.ch/record/1176380.
[4] LEP design report. CERN, Geneva, 1984. http://cdsweb.cern.ch/record/102083.
[5] The ALICE Collaboration, The ALICE experiment at the CERN LHC , Journal of
Instrumentation 3 (2008) no. 08, S08002.
http://stacks.iop.org/1748-0221/3/i=08/a=S08002.
[6] ATLAS Collaboration, The ATLAS Experiment at the CERN Large Hadron Collider , JINST 3
(2008) S08003.
[7] The CMS Collaboration, The CMS experiment at the CERN LHC , Journal of Instrumentation
3 (2008) no. 08, S08004.
[8] The LHCb Collaboration, The LHCb Detector at the LHC , Journal of Instrumentation 3 (2008)
no. 08, S08005.
[9] M. Bajko et al., Report of the Task Force on the Incident of 19th September 2008 at the LHC.
oai:cds.cern.ch:1168025 , Tech. Rep. LHC-PROJECT-Report-1168.
CERN-LHC-PROJECT-Report-1168, CERN, Geneva, Mar, 2009.
https://cdsweb.cern.ch/record/1168025.
[10] ATLAS Collaboration. Online.
https://twiki.cern.ch/twiki/bin/view/AtlasPublic/LuminosityPublicResults.You can also read


