MHD Supply Chain Solutions September/October 2018
←
→
Page content transcription
If your browser does not render page correctly, please read the page content below

MHD Supply Chain Solutions
September/October 2018

1
2
3

MHD SUPPLY CHAIN
“
When I was in industry, we used the
term ‘continental drift’ to describe the
way marketing and sales would slowly
We need to set and imperceptibly drift apart as the year
up the demand progressed to the point where it was
almost impossible to bring them back
planning and
together until the next annual planning
forecasting cycle, and even then, that was a struggle.
environment Senior marketing and sales managers
should, therefore, routinely spend one-
to ensure the
to-two hours a month reviewing the
behavioural 24-month demand plan. The key elements
and process and flow of this meeting are shown in
Figure 7. To support this, companies often
characteristics are Figure 8. Demand
measure where time is spent. The key planning time allocation.
understood and parameters can be easily jotted down just
well embedded. using pen and paper, or set up in a simple a 5. Consensus demand planning
”
spreadsheet to measure: “When I get everyone together to debate
• Data accuracy / integrity discussion – the demand plan, all I get is what I want,
this should be zero. and then it turns out to be wrong. There’s’
• Process integrity discussions – this got to be a better way to forecast,” sales
should be zero. director’s dilemma.
• Assumption performance and key When the term ‘consensus forecasting/
metrics – ideally this should be about demand planning’ is used, most people think
15% of the time. that it is a group of people sitting around
• The short term, i.e. next three months – a boardroom table coming to a consensus
ideally this should be no more than 10% on the plan. This is not the definition of
of the time. ‘consensus’, and doing it this way only leads
• The next 12 months and this financial to ‘group think’.
year – ideally about 35% of the time. Similar techniques to consensus
• Months 13 to 24 – ideally about 40% of forecasting, such as the Delphi technique and
the time. ‘panel forecasting’ have varying degrees of
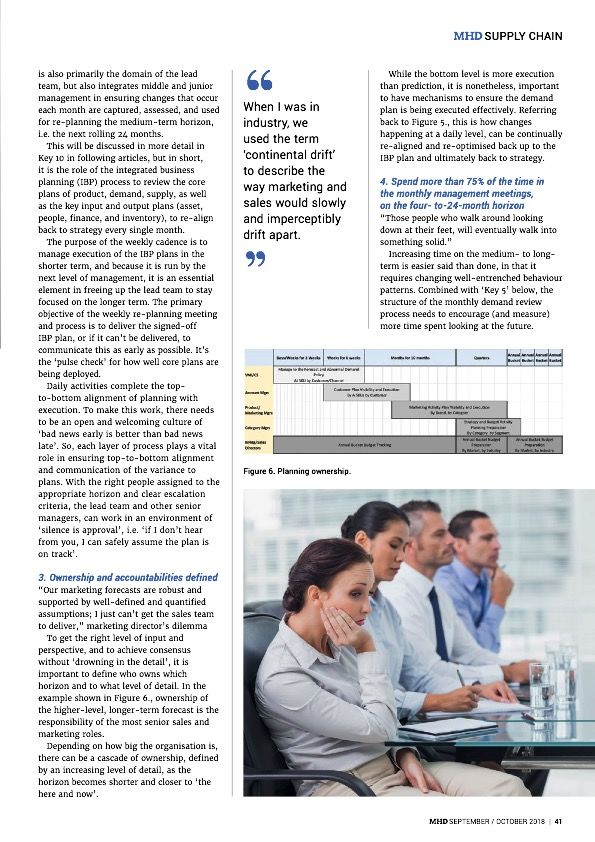
Figure 8. is a representation of where time success, but to truly arrive at a consensus, the
should be spent in the monthly cycle (IBP), process needs to have three essential criteria:
but as shown in Figure 5., to facilitate this, an 1/ The individual forecasts must be done
organisation also needs a weekly re-planning in isolation and derived from those
process, which we call integrated tactical forecasters’ perspectives.
planning (ITP), whose charter is to deploy 2/ Key drivers or underlying assumptions
the monthly plan through a series of weekly have to be documented to describe the
re-balancing iterations. This is to focus thinking behind how the numbers and
where time is spent on the shorter term. plans were generated.
1. Start with a review of progress to strategy or critic success factor – this sets the longer-term
perspective up front.
2. Assess changes to key strategic assumptions (also known as key performance drivers) – this
is one of the most critical areas in managing strategically and will be discussed in more detail
later under Key 6 in Part 2.
3. Analyse performance of key operational metric (forecast accuracy and bias) – at least a little
time needs to be spent on history to make sure we are continually getting better at planning
and execution.
4. Review projections in aggregate – an important element is to not “get lost in the detail”, so
several families / aggregates / categories, are the best way to view the new demand plans,
knowing that the detail is being managed by the demand management and planning team.
5. Identify upsides and downsides to the projections, and most importantly, agreeing and
documenting the contingency actions that will be deployed.
6. Model possible scenarios for major events not covered in point 5 above.
Figure 7. Demand planning review structure.
42 | MHD SEPTEMBER / OCTOBER 2018
4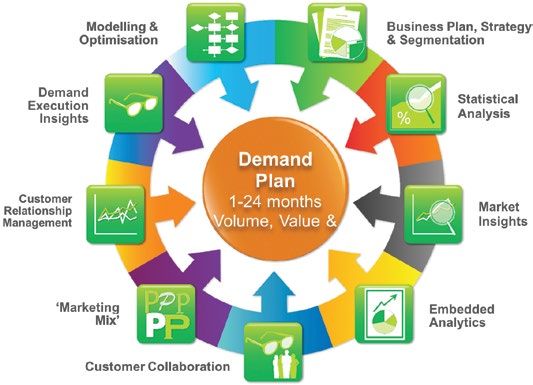
3/ The consensus is reached by rigorous                                The critical elements are to ensure there is
       challenge and debate about the different                          an ‘anchor’ as a starting point, ownership is
       sets of assumptions and perspective, not                          defined for both horizon and level of details,
       the actual numbers themselves.                                    and multiple perspectives are not only
    4/ This has been demonstrated to deliver                             allowed for, but encouraged, before coming
       good forecast outcomes, as well as                                to a consensus on best possible demand
       minimising the group think effect.                                plans based on the knowledge we have at
       Typically, the three primary perspectives                         hand today. As a last word in this section, I
       in most businesses are sales, marketing,                          quote Brad Pitt in the movie Moneyball, “...
       and statistical forecasts, but could also                         it is a process, a process, a process ....”
       include many other inputs, as shown in                              In the next articles we will explore what to
       Figure 9.                                                         do with the demand plan once we have the
    5/ Each of these inputs needs to be                                  process embedded in the business.
       quantified and time-phased, so there can
       be an ‘apples-to- apples’ comparison.                             To be continued. Rod Hozack is a partner
    6/ A good starting point is to set up                                at Oliver Wight. For more information email
       different views for sales and marketing,       Figure 9. Demand   information@oliverwight.com or visit
       and add statistical forecasting projections    planning inputs.   www.oliverwight.com. ■
       to anchor the plans. Such as:
    7/ - Sales forecast by ‘A’ SKU, by customer,
       for the first six months – the bottom-up
       forecast.
    8/ - Marketing forecast by category for
        months one to 24 – the top-down
        forecast.
    9/ - Document assumptions supporting
        each forecast.
    10/ - Gaps to the bottom-up and top-down
        forecast, and the ‘step’ at month six, then
        become the topic of dialogue and debate.
    11/ The important point is that we want
        to debate the ‘thinking’ behind the
        numbers, not the numbers themselves.

    SUMMARY
    We need to set up the demand planning
    and forecasting environment to ensure the
    behavioural and process characteristics are
    understood and well embedded.

                                                                                     MHD SEPTEMBER / OCTOBER 2018 | 43

5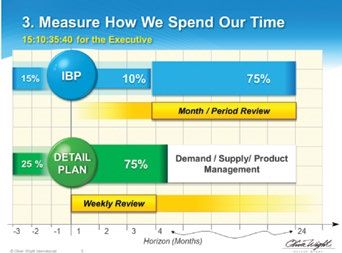
You can also read