What is the Impact of Changing Football Manager 2012 - A full version of this research will be released by the LMA at the end of the 2011-2012 ...
←
→
Page content transcription
If your browser does not render page correctly, please read the page content below
What is the Impact of Changing
Football Manager 2012
A full version of this research will be released
by the LMA at the end of the 2011–2012 Season

Dr Sue Bridgewater
sue.bridgewater@wbs.ac.uk
What is the Impact of Changing Football Manager 2012
A full version of this research will be released by the LMA at the end of the 2011-
2012 Season
Dr Sue Bridgewater
sue.bridgewater@wbs.ac.uk
The Case of Chelsea FC
The number of managers who have occupied the hotseat at the Premier League clubs
currently contesting the Champions League differs dramatically. From Manchester
United, who have had Sir Alex Ferguson in charge since 1986, before the formation of
the Premier League to Chelsea and Manchester City who have both seen a far greater
number of managers come and go. The number of managers per club since 1992 is
shown below
Table 1: Managers per Club since 1992
Club Number of Managers Average Tenure since
1992 in years
Manchester United 1 21
Arsenal 3 8.47
Chelsea 12 1.7
Liverpool 6 3.991
Manchester City 11 1.86
Tottenham 10 1.89
Both Manchester United and Arsenal have had considerable stability over this time,
whilst at the other end Chelsea, Manchester City and Tottenham the number of
managers who have been in place during this time period is into double figures and
average stands at below two years.
The following data studies in greater detail the impact of changes in football manager at
Chelsea FC both because this is topical, because Tottenham have already been studied
above and because both Tottenham and Manchester City have both achieved a greater
level of stability in recent seasons. Harry Redknapp has now been in post at Tottenham
for 3.37 years and Roberto Mancini for 2.2 years at Manchester City.
At Chelsea, whilst average tenure since 1992 has been 1.7 years, the tenure for the last
seven managers (from Claudio Ranieri up to Andreas Villas-Boas) stands at 1.6 years
but for the last five managers, from Avram Grant to Andreas Villas-Boas, only 0.86
years). As average tenure appears to be declining rather than increasing, the data for
Chelsea are studied in more detail to below to study the impact of this instability on the
club.
1
Excludes incumbent where this is likely to suppress average eg: Di Matteo at Chelsea, Dalglish at Liverpool etc
but includes incumbent at Arsenal and Manchester United where there would either be no value (Manchester
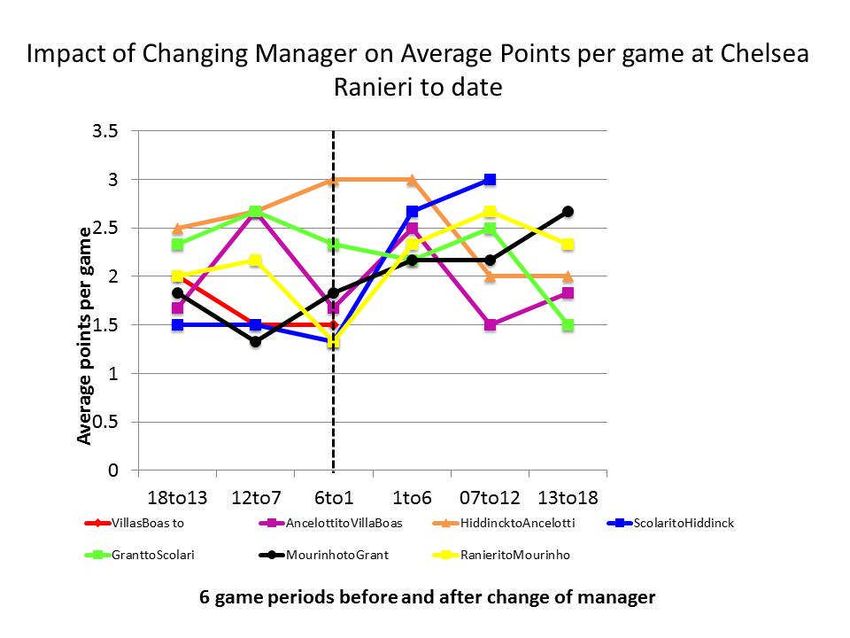
United) or a much lower value is a longstanding incumbent was omitted.As with the data for Tottenham Hotspur and Arsenal, a range of different patterns can be seen in how the managers performed before and after a change of manager took place. From this, it can be seen that, whilst the average points scores of Andreas Villas-Boas were towards the lower end of the scale, he was nonetheless dismissed with a higher average points rate than either Claudio Ranieri or Luis Felipe Scolari. In terms of what impact there has been for Chelsea in changing football manager, some of the changes resulted in dramatic honeymoon period improvements in performance. The appointment of Jose Mourinho (shown as the yellow line in Figure 1), for example, raised average points per game above 2 points per game and reached 2.67 points per game between 7 and 12 games after appointment, although this had fallen back somewhat to 2.33 points per game by the 18 game mark. Figure 1: Changing Managers at Chelsea FC from Ranieri (Sept 2000) to date The most significant shift in average points per game – and indeed the highest overall average points per game – can be seen during the tenure of Guus Hiddinck (shown as the blue line in Figure 5 above). This is perhaps not surprising as Guus Hiddinck was not dismissed for a poor run of results, but left as planned to return to international management. Note that the blue line stops short before the 18 games after appointment mark, as Guus Hiddinck was not in post long enough to reach this mark. The change from Hiddinck to his successor, Carlo Ancelotti, shown as the orange line in Figure 5, shows that the change (indicated by the vertical dotted black line at the point at which this occurs) happens when Chelsea are achieving an average of 3 points per game. The detailed data can be seen in Table 2 below. Whilst we might infer differences from these upturns and downturns in performance over time, it should be noted that we might have made similar inferences about managerial ability from the Arsenal data in Figure 4,
although we know that Arsène Wenger, beyond the timescale shown in that chart, went
on to achieve the highest average points per game of the managers studied. This might
be taken as a cautionary tale for reading too much into performance over a short time
horizon.
Table 2: Average points per 6 games before and after change of Manager at Chelsea FC
Chelsea Managers Average Points per 6 game Average Points per 6 game
period before change period after change
18to13 12to7 6to1 1to6 07to12 13to18
VillasBoas to… 2.00 1.5 1.5
Ancelotti to VillaBoas 1.67 2.67 1.67 2.5 1.5 1.83
Hiddinck to Ancelotti 2.5 2.67 3 3 2.00 2
Scolari to Hiddinck 1.5 1.5 1.33 2.67 3
Grant to Scolari 2.33 2.67 2.33 2.17 2.5 1.5
Mourinho to Grant 1.83 1.33 1.83 2.17 2.17 2.67
Ranieri to Mourinho 2 2.17 1.33 2.33 2.67 2.33
Vialli to Ranieri 1.66 1.67 2.33
Note: these data are based on league games only
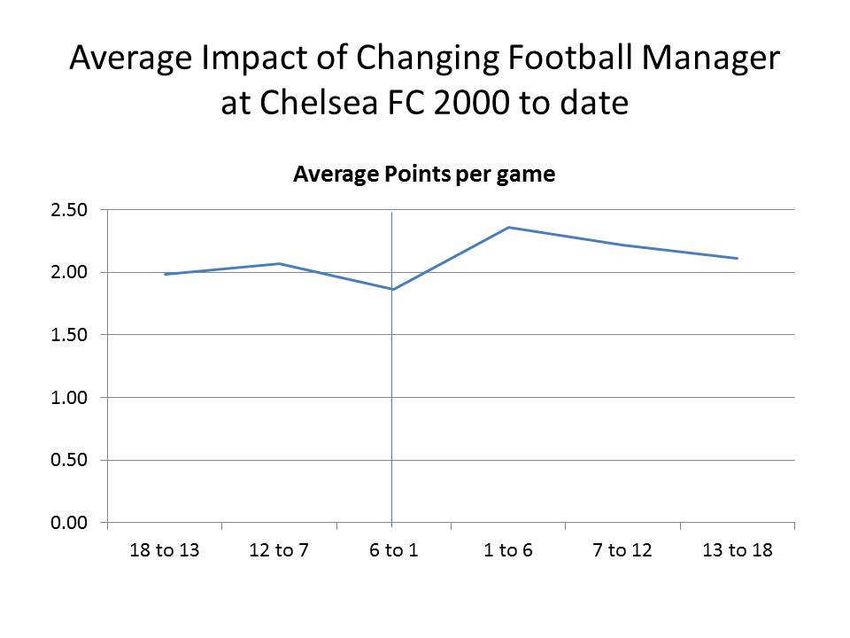
It is perhaps more interesting, then, to look at the broader patterns in the data and see
what the average impact has been for Chelsea FC in changing its football manager.
Figure 2: Average Points impact of Changing Chelsea ManagerFrom Figure 2, there is an average increase in points during the honeymoon period, but given that this is from a high base – Chelsea have averaged above or just below 2 points per game even during the periods in which they are adjudged to have gone through a downturn in performance – and has fallen back to 2.11 points per game by the 18 game mark, the difference of 0.11 points per game from steady state before to steady state after change of manager may not appear worth the many millions of pounds in costs of changing football manager. Conclusions There are a number of possible explanations for this. The first is that leadership has little impact on organisational performance. Lieberson and O’Connor 1972) suggest organizational performance is more influenced by other aspects of the organisational context such as resources. So perhaps performance might be affected by the quality of players, injuries or just bad luck. The second explanation is that switching to a different leader brings with it disruption which, in itself, can have a negative effect on performance (Grusky 1960, 1963, 1964). Hope (2003) suggests that there are different phases in a football manager’s lifespan – some in which he may have a run of bad luck or a blip and others where performance may take a downturn whilst the manager is rebuilding for the longer term. This research is not suggesting that a club should never change football manager. As in other organisations, sustained decline in performance is often addressed by changing manager – and this may arrest and turnaround performance. The data would
suggest, however, that clubs may pull the trigger during a minor blip in performance
rather than a sustained decline. Moreover, the level at which they do this, and the
benefits gained from the switch may be less significant than they anticipate.

References
Brown, M C (1982) “Administrative Succession and Organizational performance: The
Succession Effect” Administrative Science Quarterly, 27: 1 – 16
Gamson, W and Scotch, N (1964) “Scapegoating in baseball” American Journal of
Sociology, 70: 69 - 76
Hope, C. (2003) "When should you sack a football manager? Results from a simple
model applied to the English Premiership." Journal of the Operational Research
Society, 54(11): 1167-1176
You can also read