CONFERENCE CALL First half year 2019 results - IMCD N.V. 16 August 2019
←
→
Page content transcription
If your browser does not render page correctly, please read the page content below

CONFERENCE CALL
First half year 2019 results
IMCD N.V. 16 August 2019
Page 2
Disclaimer

This presentation may contain forward looking statements. These statements are based on current expectations,
estimates and projections of IMCD’s management and information currently available to the company. IMCD
cautions that such statements contain elements of risk and uncertainties that are difficult to predict and that could
cause actual performance and position to differ materially from these statements. IMCD disclaims any obligation to
update or revise any statements made in this presentation to reflect subsequent events or circumstances, except as
required by law.

Presenting team                                                                                      Page 3

         Piet van der Slikke, CEO                          Hans Kooijmans, CFO

                     •   Led the formation of                       •   Joined IMCD in 1996
                         IMCD since 1995
                                                                    •   Co-led formation of IMCD
                     •   Designed and executed IMCD’s
                         strategy
                                                                    •   23 years of industry experience

                     •   24 years of industry experience
Agenda                                Page 4

•   Company profile
•   Highlights first half year 2019
•   Financials first half year 2019
•   Outlook
•   Q&A
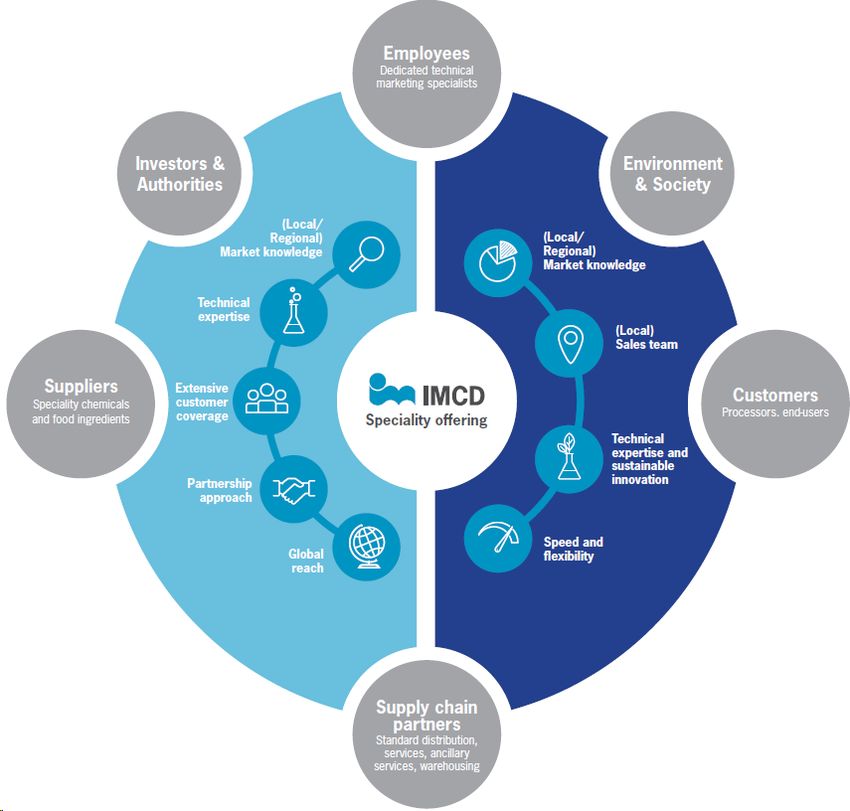
Company profile                                         Page 5

IMCD is a market-leader in the sales, marketing and
distribution of speciality chemicals and food
ingredients. Its result-driven professionals provide
market-focused solutions to suppliers and
customers across EMEA, Asia-Pacific and
Americas, offering a range of comprehensive
product portfolios, including innovative formulations
that embrace industry trends.

Listed at Euronext, Amsterdam (IMCD), IMCD
realised revenues of € 2,379 million in 2018 with
nearly 2,800 employees in over 45 countries on 6
continents. IMCD's dedicated team of technical and
commercial experts work in close partnership to
tailor best in class solutions and provide value
through expertise for around 43,000 customers and
a diverse range of world class suppliers.
Agenda                                Page 6

•   Company profile
•   Highlights first half year 2019
•   Financials first half year 2019
•   Outlook
•   Q&A
Highlights first half year 2019                                                                       Page 7

                         Gross profit growth of 19% to EUR 312.0 million (+18% on a constant
Gross profit
                         currency basis)

  Operating              Operating EBITA increase of 17% to EUR 123.1 million (+17% on a
   EBITA                 constant currency basis)

                          Net result before amortisation and non-recurring items increase of 14% to
  Net result
                          EUR 84.8 million (+14% on a constant currency basis)

                          Cash earnings per share increased by 22% to EUR 1.60 (first half of 2018:
  Cash EPS                EUR 1.31)
Agenda Page 8 • Company profile • Highlights first half year 2019 • Financials first half year 2019 • Outlook • Q&A
Financials first half year 2019                                                                                                       Page 9

Income statement
                                                                  Jan.1 - June 30 Jan.1 - June 30                           fx adj.
EUR million
                                                                                                        change    change
                                                                       2019            2018                                change

Revenue                                                                          1,398          1,152     246       21%      20%

Gross profit                                                                        312          263        49     19%       18%
Gross profit in % of revenue                                                     22.3%          22.8%    (0.5%)

Operating EBITDA                                                                    134          108        26      24%      24%
Operating EBITDA in % of revenue                                                   9.6%          9.3%     0.3%

Operating EBITA¹                                                                    123          105        18     17%       17%
Operating EBITA in % of revenue                                                    8.8%          9.1%    (0.3%)

                        2
Conversion margin                                                                39.5%          40.0%    (0.5%)

¹ Result from operating activities before amortization of intangibles and non-recurring items
2
  Operating EBITA in percentage of Gross profit
Financials first half year 2019 Page 10
Income statement
Asia Holding
EMEA Americas Total
EUR million
Pacific companies
Gross profit H1 2019 173 99 39 312
H1 2018 158 71 35 263
∆ reported 10% 41% 14% 19%
∆ constant currency 11% 36% 13% 18%
Operating EBITA H1 2019 71 42 17 (7) 123
H1 2018 70 28 16 (9) 105
∆ reported 1% 49% 11% 18% 17%
∆ constant currency 3% 42% 11% 19% 17%
Operating EBITA in % of revenue H1 2019 10.2% 8.2% 9.0% 8.8%
H1 2018 11.1% 8.0% 9.6% 9.1%
∆ margin % (0.9%) 0.2% (0.6%) (0.3%)
Conversion margin H1 2019 41.0% 42.2% 44.4% 39.5%
operating EBITA in % of gross profit H1 2018 44.5% 39.9% 45.6% 40.0%
∆ margin % (3.5%) 2.3% (1.2%) (0.5%)Financials first half year 2019 Page 11
Income statement
Asia Holding
EMEA Americas Total
EUR million
Pacific companies
Impact IFRS 16 operating EBITA
H1 2019 excluding IFRS 16 impact 71.4 41.9 17.3 (9.2) 121.4
Impact IFR 16 (0.4) 0.1 0.1 1.9 1.7
H1 2019 including IFRS 16 impact 71.0 42.0 17.4 (7.3) 123.1Financials first half year 2019 Page 12
Income statement (continued)
Jan.1 - June 30 Jan.1 - June 30 fx adj.
EUR million
change change
2019 2018 change
Operating EBITA 123 105 18 17% 17%
Net finance costs (13) (9)
Income tax expenses (26) (22)
Net result before amortísation/non recurring
85 74 11 14% 14%
items
Amortisation of intangible assets (21) (17)
Tax credits related to amortisation 1 2
Non recurring items (1) (5)
Result for the period 64 54 11 20% 20%
Earnings per share (weighted) 1.23 1.02 0.21 21% 20%
Cash Earnings per share (weighted) 1.60 1.31 0.29 22% 22%Financials first half year 2019 Page 13
Balance Sheet
30 June 31 December impact 31 December 30 June
2019 2018 IFRS 16 2018 2018
EUR million restated reported
Property, plant and equipment 79 77 52 25 18
Intangible assets 1,042 1,052 12 1,040 931
Other fin. assets/def tax assets 44 47 47 27
Working capital 446 400 400 356
Provisions/employee benefits (30) (31) (31) (19)
Deferred tax liabilities (82) (84) (84) (67)
Capital employed 1,497 1,461 64 1,397 1,246
Equity 814 786 786 739
Equity in % of capital employed 54% 54% 56% 59%
Loans and borrowings minus cash 684 675 64 611 506
Total financing 1,497 1,461 64 1,397 1,246
Leverage ratio*
Reported 2.9 3.1 0.3 2.8 2.7
Based on loan documentation 2.7 2.8 - 2.8 2.7
*Net Debt/Operating EBITDA (incl. full year impact acquisitions)Financials first half year 2019 Page 14 Working capital EUR million 30 June 2019 31 December 2018 30 June 2018 Inventories 348 354 281 in days of revenue* 45 49 44 Trade and other receivables 467 398 406 in days of revenue* 60 55 64 Trade payables (288) (264) (251) in days of revenue* (37) (36) (39) Other payables (81) (89) (81) in days of revenue* (10) (12) (13) Total working capital 446 400 356 in days of revenue 58 55 56 * normalised for impact acquisitions
Financials first half year 2019 Page 15
Financials first half year 2019                                                                                             Page 16

Free cash flow
                                                              Jan.1 - June 30      Jan.1 - June 30
EUR million
                                                                                                       change      change
                                                                   2019                 2018

Operating EBITA                                                           123.1              105.2        17.9        17%

Depreciation                                                               10.7                 2.3        8.4

Operating EBITDA                                                          133.8              107.5        26.3        25%

Share based payments                                                        1.2                 1.1         0.1
IAS 17 lease payments                                                      (9.5)                           (9.5)
Capex                                                                      (2.2)               (1.8)       (0.4)

∆ Working capital1                                                        (42.5)              (52.7)      10.2

Free cash flow                                                             80.9                54.0       26.9        50%
                         2
Cash conversion ratio                                                     60.5%               50.2%       10.3%

¹ Inventories, Trade and other receivables and Trade and other payables
2
  Free cash flow in percentage of Operating EBITDA
Page 17 Agenda • Company profile • Highlights first half year 2019 • Financials first half year 2019 • Outlook • Q&A
Page 18
Outlook

IMCD operates in different, often fragmented market segments in multiple geographic regions, connecting many
customers and suppliers across a very diverse product range. In general, results are impacted by macroeconomic
conditions and developments in specific industries. Furthermore results can be influenced from period to period by,
amongst others, the ability to maintain and expand commercial relationships, the ability to introduce new products and
start new customer and supplier relations and the timing, scope and impact of acquisitions.

IMCD’s consistent strategy and resilient business model has led to successful expansion over the years and IMCD
remains focused on achieving earnings growth by optimising its services and further strengthening its market positions.
IMCD sees interesting opportunities to increase its global footprint and expand the product portfolio organically and by
acquisitions.

Based on the performance in the first half of 2019 and the strong fundamentals of the business, IMCD expects operating
EBITA growth in 2019.
Page 19
Agenda

•   Company profile
•   Highlights first half year 2019
•   Financials first half year 2019
•   Outlook
•   Q&A
You can also read