Mapping habitat distribution, vegetation structure and flooding dynamics in the Amazon basin wetlands - EORC
←
→
Page content transcription
If your browser does not render page correctly, please read the page content below
K&C Phase 4 – Status report

Mapping habitat distribution, vegetation
structure and flooding dynamics in the
       Amazon basin wetlands
          Thiago Sanna Freire Silva
             Ecosystem Dynamics Observatory
                  Geography Department
         São Paulo State University (UNESP), Brazil

                 Science Team meeting #24
              Tokyo, Japan, January 29-31, 2018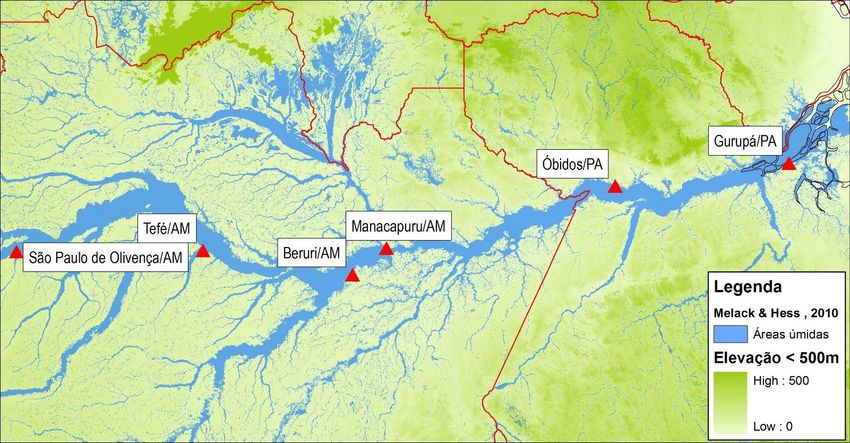
Project outline and objectives

• Make use of the existing PALSAR record and upcoming
  PALSAR-2 data to derive improved basin-wide maps of
  wetland habitat and flooding characteristics for the
  Amazon basin wetlands, explicitly considering inundation
  patterns and vegetation structural characteristics.

• These improved maps will allow for more accurate
  regionalizations of carbon dynamics, and offer much
  needed support for large-scale biodiversity studies and
  conservation efforts in the Amazon wetlands.
Specific activities

• Mapping habitat/vegetation cover

• Mapping flood duration

• Vegetation structure

• Vegetation carbon monitoring

• Applications to conservation
Results and significant findings - Habitat/Vegetation Mapping
Results and significant findings - Habitat/Vegetation Mapping
Results and significant findings - Habitat/Vegetation Mapping
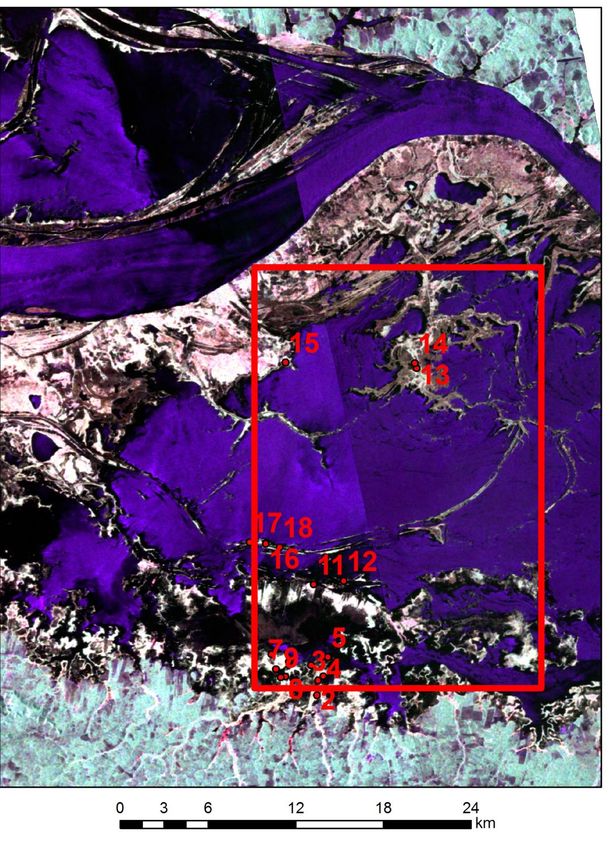
Multitemporal PALSAR-1 data 40
38 38.5m 1999-06-28
•FBS/FBD imagery
36
•Covering the largest possible 34
Stage Height (m)
hydrological range 32
•Image segmentation and feature 30
extraction using eCognition (hopefully 28
RSGISlib for now on!) 26
24
•Supervised classification using
21.7m 1995-09-15
Random Forests 22
20
1 2 3 4 5 6 7 8 9 10 11 12 13 14 15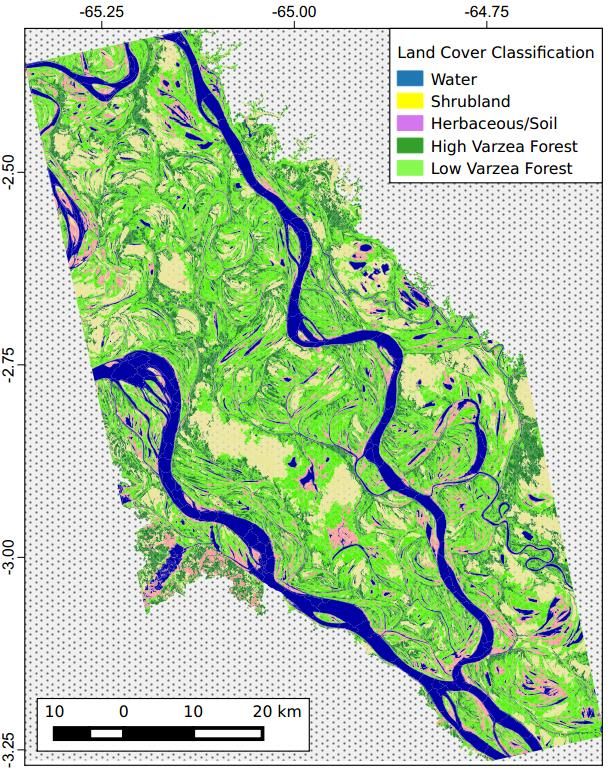
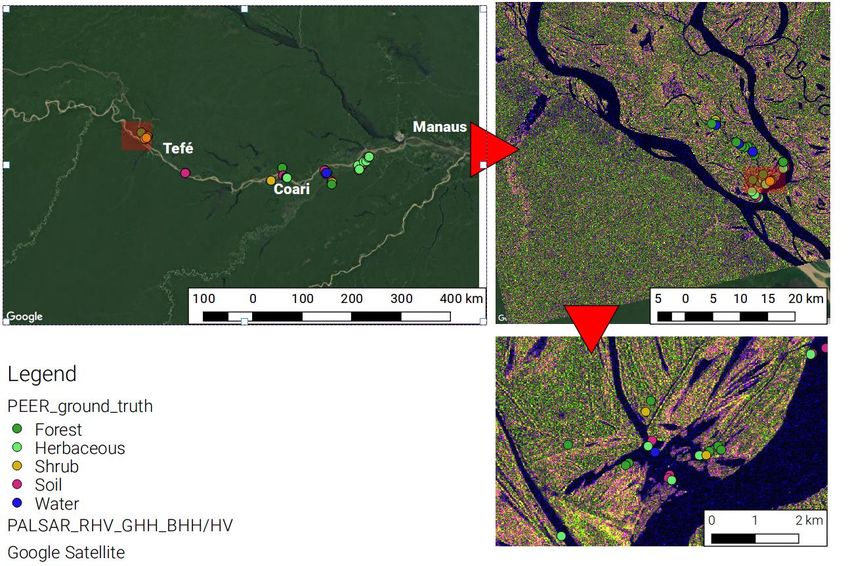
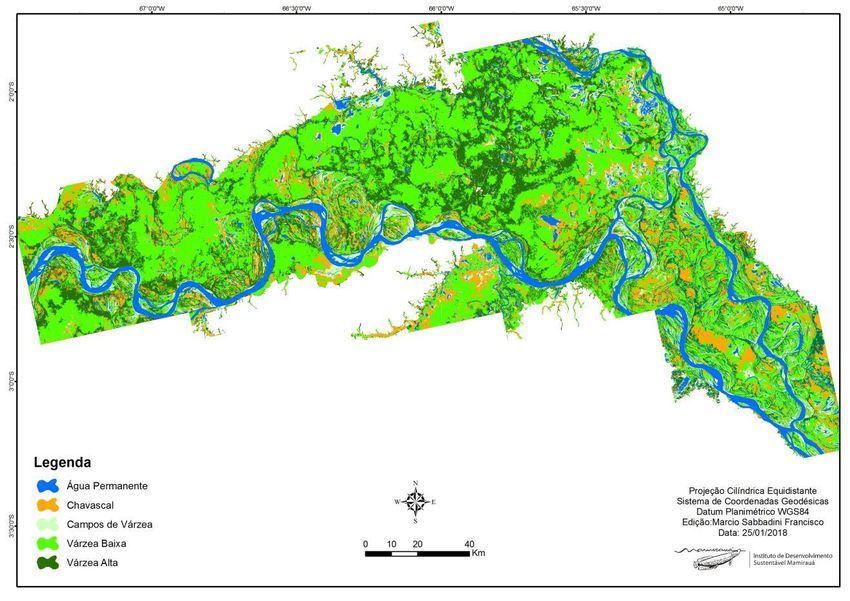
•83% accuracy (kappa 0.8)

•10% Allocation, 5% Quantity Disagreement

•Low várzea sites are very heterogeneous

•Difficulty in mapping sparse herbaceous
vegetation / bare soil
• Progressively expanding to new
  sites "on demand"

• Limited by training/validation data
• Coarse inundation "steps"

• VERY Limited validation data
Igapó - Black water forest

  Undergoing
 final reviews
      for
  submission

                             Angelica Resende
                             INPA
Ground training and validation data for large-scale mapping (Oct;Nov 2017)
Probability of Inundation:

- Stage height (Mamirauá Lake)
- Distance to nearest water body
- Height above the nearest drainage (HAND)

               Ferreira-Ferreira et al. (in prep for submission)
Ferreira-Ferreira et al. (in prep for submission)
Ferreira-Ferreira et al. (in prep for submission)
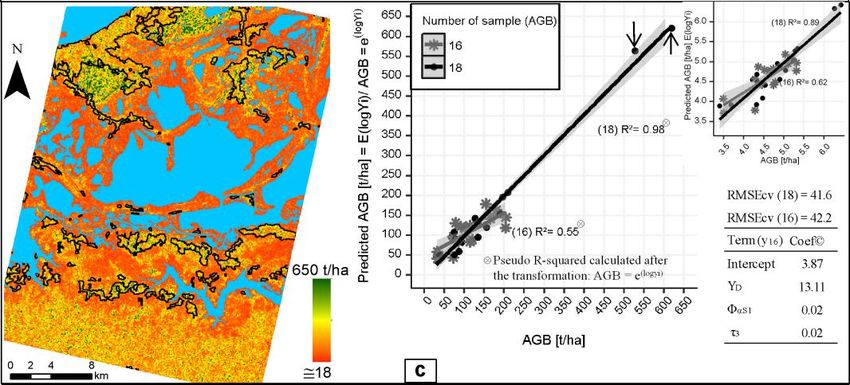
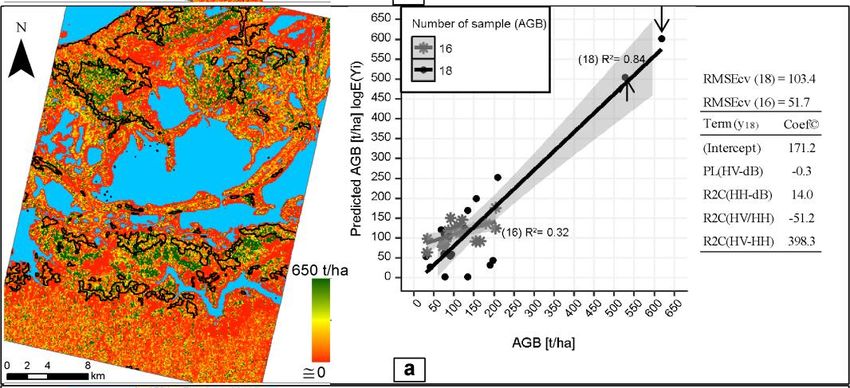
PALSAR image   R(HH) B(HV) G(VV)

  Vegetation Structure

  Sensor     Operation Mode Observation Start Date Rainfall(mm)
PALSAR             PLR            30/03/2009           14.9
PALSAR             PLR            15/05/2009           0.2
TerraSAR-X         HH             19/10/2011            x
RadarSAT       Polarimetric       20/10/2011            x
PALSAR        FBD (HH-HV)         08/10/2010            0
PALSAR        FBD (HH-HV)         25/10/2010            0
  Field work 18 (25m x 25m) data(18-29/10/2013)
Graphic OBS vs. PRED and LAI map results from the application of model selected from the
datasets: a) PL-FBD
Graphic OBS vs. PRED and LAI map results from the application of model selected from the
datasets: b) PL-FBD+TX
Graphic OBS vs. PRED and LAI map results from the application of model selected from the
datasets: c) PL-PLR
Graphic OBS vs. PRED and LAI map results from the application of model selected from the datasets: a)
PL-FBD+ RS2
Graphic OBS vs. PRED and LAI map results from the application of model selected from the datasets:
b) MULT
Graphic OBS vs. PRED and LAI map results from the application of model selected from the datasets:
e) RC2(POL)16
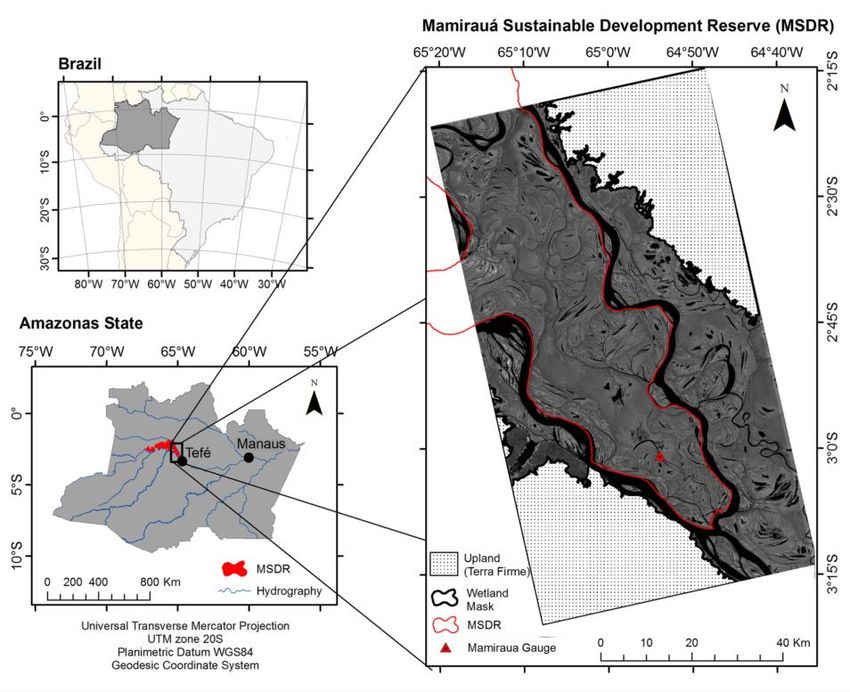
Collaborative Developments: wall-to-wall habitat mapping for the
Mamirauá Sustainable Development Reserve
Developed method applied to produce first wall-to-wall habitat map.
Map will be used to guide conservation andsustainable extraction planning in
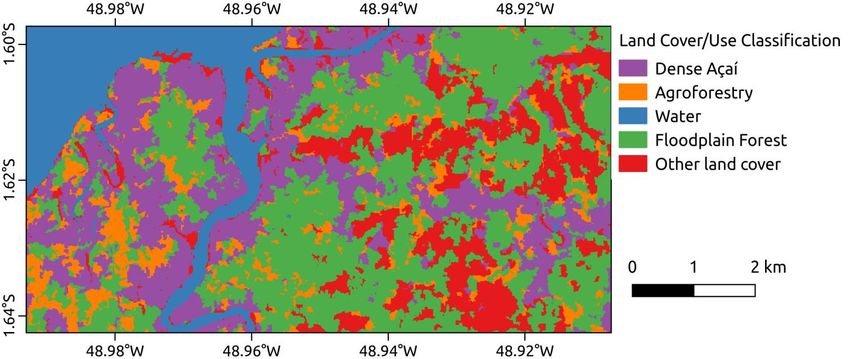
the reserve.Collaborative Developments: mapping açaí palm expansion
Using the developed methodology to differentiate between monoculture,
mixed forest-plantation, and untouched floodplain forest near Belém (PA,
Brazil) (collaboration with Madson Freitas and Allistair Campbell)Project milestones so far • Fine scale maps of land cover and flood recurrence for key areas of the Amazon floodplains, based on FBD data • Working, semi-automated algorithm for classifying land cover and flood duration for large areas of the Amazon basin • Analysis of polarimetric capabilities to predict vegetation structure from PALSAR-2 for selected floodplain sites
Project milestones for 1-yr extension

• Derivation of an updated and improved habitat and flooding
  map for the central Amazon wetlands

• Validation of the basin wide map using high resolution imagery
  and available ground data

• Comparisons between fine beam and mosaic mapping
  accuracies
Deliverables for 1-yr extension
▪ Fine scale habitat and flood duration maps for the Amazon river and
main tributaries
▪ Method to model flood duration from inundation mapping
▪ Publications:
▪ Ferreira-Ferreira et al. (2018). Empirical modeling of flood duration in Amazon floodplain
environments based on time-series of ALOS/PALSAR-1 fine beam imagery. To be submitted
to Remote Sensing of Environment by March 2018
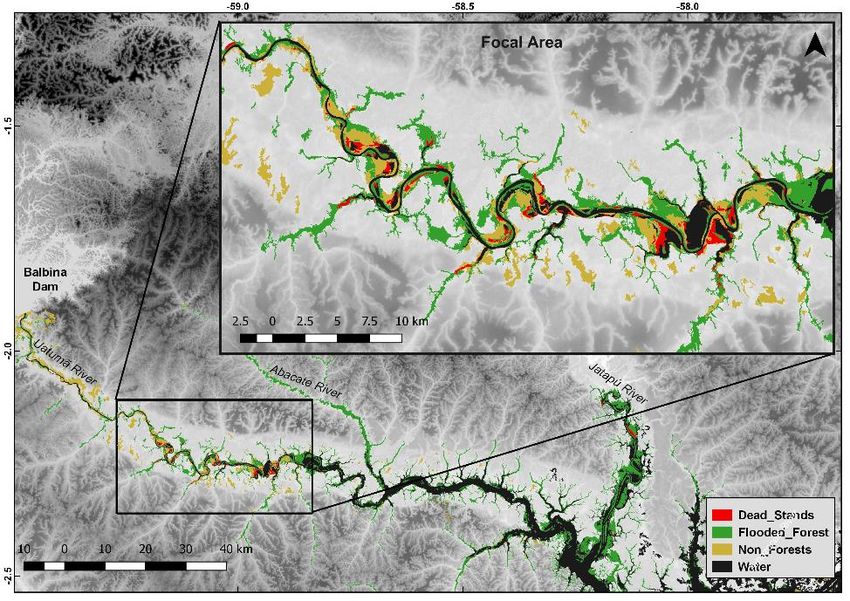
▪ Resende et al. (2018) Tree mortality from flood pulse disturbances in Amazonian floodplain
forests: the collateral effects of hydropower production. To be submitted by March 2018,
journal not yet determined.
▪ Silva et al. (2018) Mapping the expansion of açai palm (Euterpe oleracea) in the lower
Amazon using combined PALSAR-1 and Sentinel-1 synthetic aperture radar imagery. To be
submitted to the Remote Sensing K&C special issue. Preferred submission on second
quarter of 2018.
▪ Silva et al. (2018) Mapping fine scale distribution of floodplain habitats for major Amazon
Rivers. To be submitted for the Wetlands K&C special issue. Preferred submission on
third quarter of 2018.PALSAR/PALSAR-2 ScanSAR mosaics
We will compare results obtained with the Fine Beam imagery with
results obtained using the PALSAR-2 mosacis, to assess if a larger
scale / more automated mapping method could be achieved by
using the mosaics instead.You can also read