Analyzing Impacts of Major Events: A Case Study of the Los Angeles Memorial Coliseum - PSR Speaker Series Feb 18, 2021 Genevieve Giuliano and ...
←
→
Page content transcription
If your browser does not render page correctly, please read the page content below
Analyzing Impacts of Major Events: A Case Study of
 the Los Angeles Memorial Coliseum
 PSR Speaker Series
 Feb 18, 2021

 Genevieve Giuliano and Yougeng Lu
 METRANS Transportation Center, University of Southern California, Los Angeles, CA, USA
The ADMS project
 Research team
Price School: Genevieve Giuliano, Yougeng Lu, Sean Soni,
 Alanna Coombes
 Viterbi School: Cyrus Shahabi, Houwen Lin, Sepanta
 Zeighami, Chyrs Anastasiou
 Dornsife College: Yao-Yi Chiang
Background

• Problem
 • Los Angeles traffic congestion
 • More than 2,500 special events held in Los
 Angeles every year adds to recurrent
 congestion
• Objectives
 • Measure special event effects on traffic
 • Devise strategies to effectively manage
 special event traffic

• Case Study
 • Weekend football games at the LA
 Memorial Coliseum
Research Questions

• How do weekend football games at the Coliseum affect local and
 regional transportation?
 • How do games affect the highway system?
 • How do they affect local arterials near the venue?

• What can event organizers and transportation planners do to
 mitigate these impacts?
 • More real-time traffic information?
 • Parking management?
 • Transit incentives?
 • Other ???
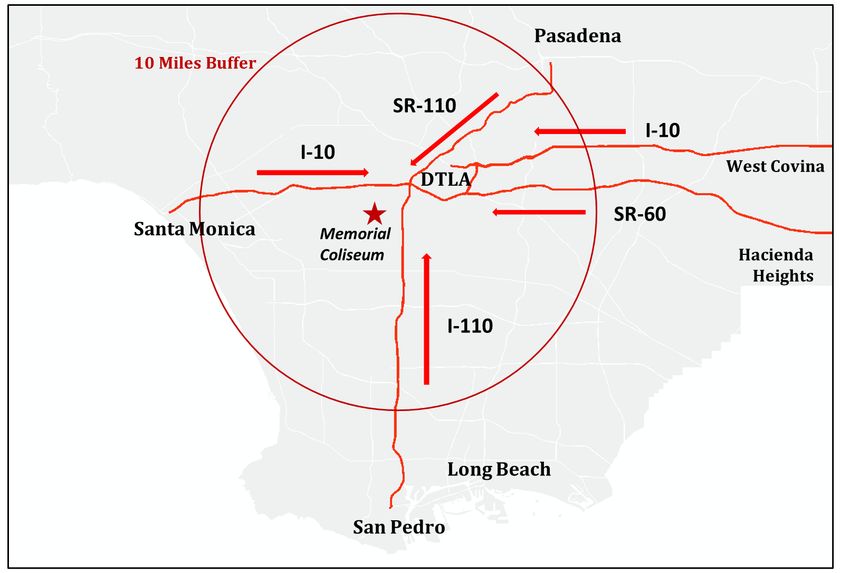
Study area

• Los Angeles Memorial
 Coliseum
 • Home of Los Angeles Rams
 and USC Trojans
• Examine
 • Highway traffic on major
 access corridors (within 10
 miles)
 • Arterial traffic around
 Coliseum (within 5 miles)
• Study Period
 • Weekend football games
 • Jan 1, 2016 to Dec 31, 2018
 Study Area
Research approach

• Compare game days with otherwise similar non-game days

 • Treatment group • Control group
 • 19 Rams game days • 39 non-game days
 • 10 USC game days • Weekend days without
 major events

 • Test for traffic speed difference between treatment and control days
 • 0-6 hours before the football game kickoff, in 15 minute intervals
Data sources

• Highways: traffic speed by
 location, minute from Caltrans 5 Miles 10 Miles

 highway detectors, stored in the
 Archived Data Management
 System (ADMS)
 Memorial
 Coliseum
• Arterials: traffic speed by
 location, minute from LADOT
 ATSAC detectors, stored in
 ADMS

 Black dots = highway sensor locations
 Red dots = arterial sensor locations

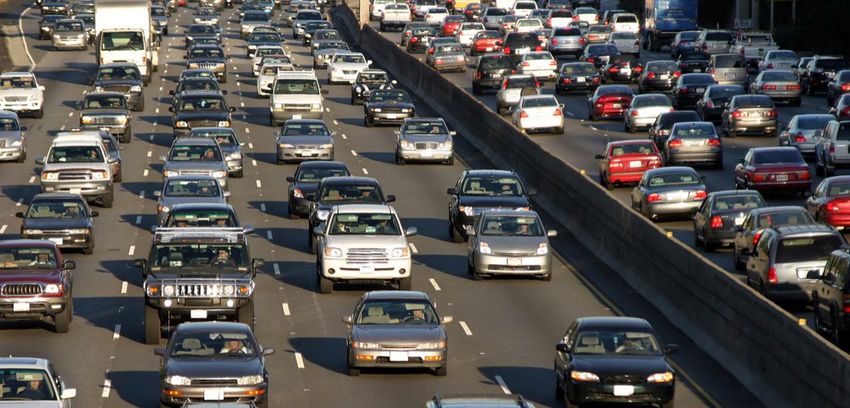
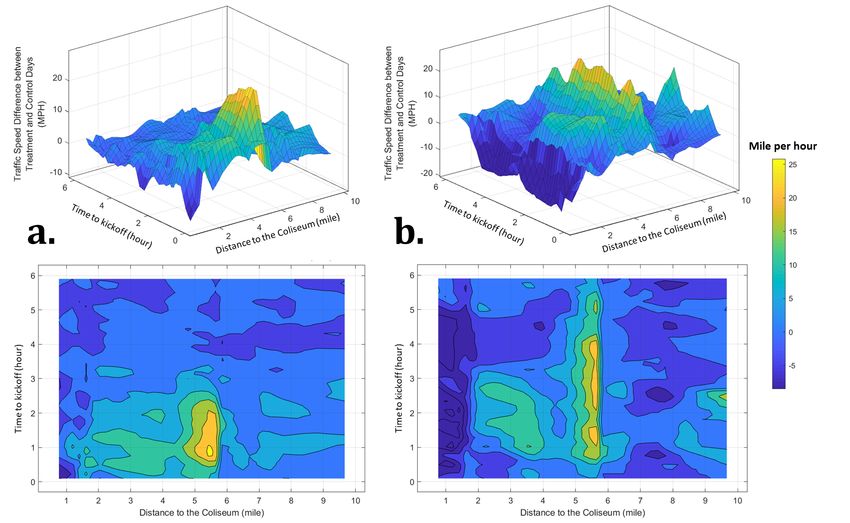
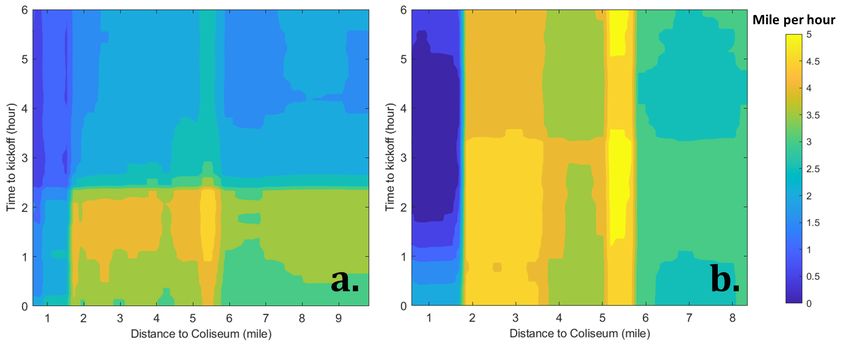
Pre-game traffic pattern- I 110 S

Rams games
 Mile per hour
 Less congestion

 I-110 & I-105
 interchange

 More congestion

Pre-game traffic pattern- I 110 S

USC games
 Mile per hour

 I-110 & I-105
 interchange

 More congestion

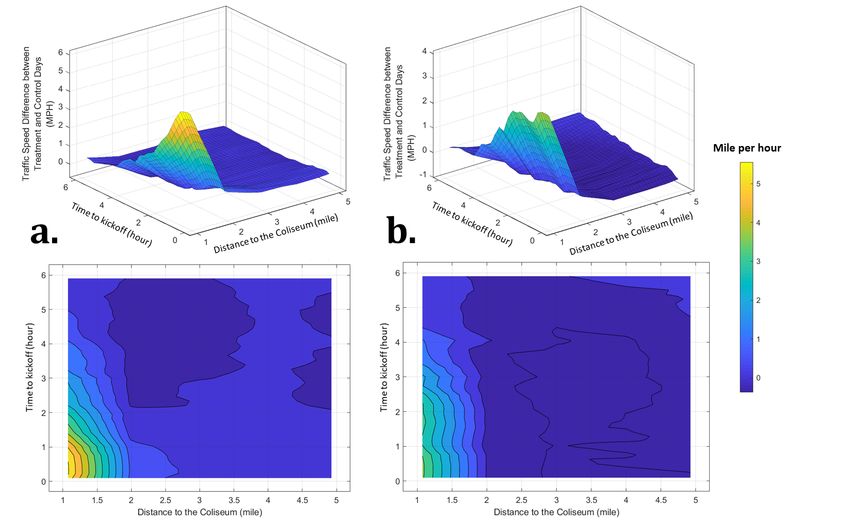
Pre-game traffic pattern- Arterials

Rams games
 Mile per hour
Pre-game traffic pattern- Arterials

USC games
 Mile per hour
Estimate game-day traffic

△ ! : Traffic speed difference at traffic detector i between game
days and control non-game days as a function of:

 Temporal autocorrelation 15-minute lagged speed difference for detector i

 Weighted traffic speed difference of nearby detectors at the same highway
 Spatial autocorrelation
 corridor

 Temporal effect Time to game kickoff in 15-minutes interval

 Spatial effect Distance of detector i to Coliseum

 Control variables Game attendance number, kickoff time dummy variables

 Fixed effects Year, month fixed effects
Two models

• Model 1. Ordinary Least Square (OLS)
 • Linear regression
 • With spatial and temporal lags

• Model 2. Random Forest (RF)
 • Machine learning algorithm
 • Accounts for non-linear
 relationships
 • Provides ranking of variable
 importance

 Structure of a Random Forest model
Result: OLS model

• The spatial and temporal OLS results for Rams games
 lag coefficients are highly
 significant and account for Independent variable I-110 N I-110 S I-10 W I-10 E Arterials
 most of the variance Time lagged term + + + + +
 explained by OLS model. Spatial lagged term + + + + +
• Other variables are of the Distance to Coliseum - - -
 expected signs but often
 not statistically significant. Time to kickoff + -
 OLS does not account for Distance to highway
•
 interchange
 - - - +
 complex nonlinear
 relationships between Attendance number
 response variable and AM game dummy +
 predictor variables.
 PM game dummy

 Signs of significant coefficients only.
Result Comparison: OLS and RF

 OLS RF • RF model performs better
Rams R2 RMSE R2 RMSE than OLS in all cases.
1-110 S 0.70 6.04 0.90 4.03
I-110 N 0.73 6.54 0.88 3.84
 • RF allows for many
 different variable
I-10 W 0.72 4.81 0.88 3.18
 transformations.
I-10/SR 60 E 0.59 3.48 0.83 2.32
Arterials 0.40 3.42 0.75 2.35 • RF also allows for
 different combinations of
USC R2 RMSE R2 RMSE variables and different
I-110 S 0.77 7.08 0.92 4.17 relationships between the
I-110 N 0.76 7.17 0.85 3.76
 independent variables.
I-10 W 0.79 6.38 0.90 3.55
I-10/SR60 E 0.58 3.85 0.82 2.43
Arterials 0.39 3.38 0.76 2.28
Non-linearities in spatio-temporal patterns:
 Highways
Rams game USC game

 • Rams attendees tend to arrive 2-3 hours prior to the start of a game, while USC attendee arrive up
 to 6 hours earlier, due to the tailgating.
 • Significant non-linear relationship between time and distance on freeways.
 • Greatest impacts of game induced traffic on freeways tend to be around existing interchange
 bottlenecks, rather than closest to the Coliseum.
 • Similar pre-game traffic on freeways from north-bound and south-bound on I-110, and east-bound
 and west-bound on I-10 and SR-60.
Linearities in spatio-temporal patterns:
 Arterials
 • More linear relationship between time and distance on arterials.
 • Game induced traffic for arterials is limited to within two miles.
 • Rams arrival pattern is more concentrated in time than USC.
Rams game USC game

 Rams USC
Findings

• Dissimilar arrival pattern for Rams and USC games. Rams game
 attendees have a more concentrated arrival pattern.
• More complicated pre-game traffic on highways than arterials.
• For highways, greatest impacts of game induced traffic on freeways
 tend to be around existing interchange bottlenecks.
• For arterials, the impact of game induced traffic is limited to within two
 miles of the Coliseum.

 What might be done to reduce congestion?
 …..some preliminary results
Possible options

1. Stagger attendees’ arrival
 pattern
2. Encourage attendees to take
 public transit
3. Do both
Method: Simulation modeling

 • Use VISSIM to build a network
Simulation 1: simulation model of the Coliseum area
Move 50% of game traffic in 3 to 0 • Use traffic data to simulate demand on
 hour time interval to 6 to 3 hour
 time interval the network
 • Compare results to base case (no
Simulation 2:
Reduce game traffic demand by
 intervention)
 20% • Simulation parameters
 • 1 PM Rams game
Simulation 3:
Both time shifting and demand • Time period: 6 to 0 hours before
 reduction game
Simulation 1 results

 0-3 hours before the game 3-6 hours before the game

 0-3 hours before the game 3-6 hours before the game
 Before VMT After VMT Change Before VMT After VMT Change
 Overall 229199 188529 -17.74% 132247 145290 9.86%
Arterial (within 2miles) 28432 23156 -18.56% 14447 15805 9.40%
 Highway 158925 133647 -15.91% 101852 111941 9.91%
Simulation 2 results

 0-3 hours before the game 3-6 hours before the game

 0-3 hours before the game 3-6 hours before the game
 Before VMT After VMT Change Before VMT After VMT Change
 Overall 229199 212148 -7.44% 132247 133474 0.93%
Arterial (within 2miles) 28432 26091 -8.23% 14447 14450 0.02%
 Highway 158925 149033 -6.22% 101852 102569 0.70%
Simulation 3 results

 0-3 hours before the game 3-6 hours before the game

 0-3 hours before the game 3-6 hours before the game
 Before VMT After VMT Change Before VMT After VMT Change
 Overall 229199 179366 -21.74% 132247 146111 10.48%
Arterial (within 2miles) 28432 21892 -23.00% 14447 15836 9.62%
 Highway 158925 128078 -19.41% 101852 112481 10.44%
Conclusions

• Simulation provides a useful way to evaluate possible policy strategies
• For RAMS games, spreading demand over a longer time period would reduce
 total congestion
 • Effectiveness of demand spreading strategy depends on overall temporal demand on the
 system
• The difference between spreading demand and shifting to public transit is the
 result of assumptions on how much demand is shifted
• Simulations assume incentive strategies – part of the research project
• Case study findings are generalizable to other major events in other locations
Thank You

Acknowledgement: This research is supported by the Los Angeles Metropolitan Transportation Authority under the LA SAFE
program. Findings do not necessarily reflect the views or policies of the sponsor. All errors and omissions are the responsibility of
the authors.
You can also read