Growth Strategy for Namibia's Game Meat Industry and Associated Value Chains - Ministry of Industrialisation, Trade and ...
←
→
Page content transcription
If your browser does not render page correctly, please read the page content below
MINISTRY OF INDUSTRIALISATION,
   TRADE AND SME DEVELOPMENT

Growth Strategy
 for Namibia’s
   Game Meat
  Industry and
Associated Value
     Chains

             Meat Prod
         e
     m

                        uc
   Ga

                          ts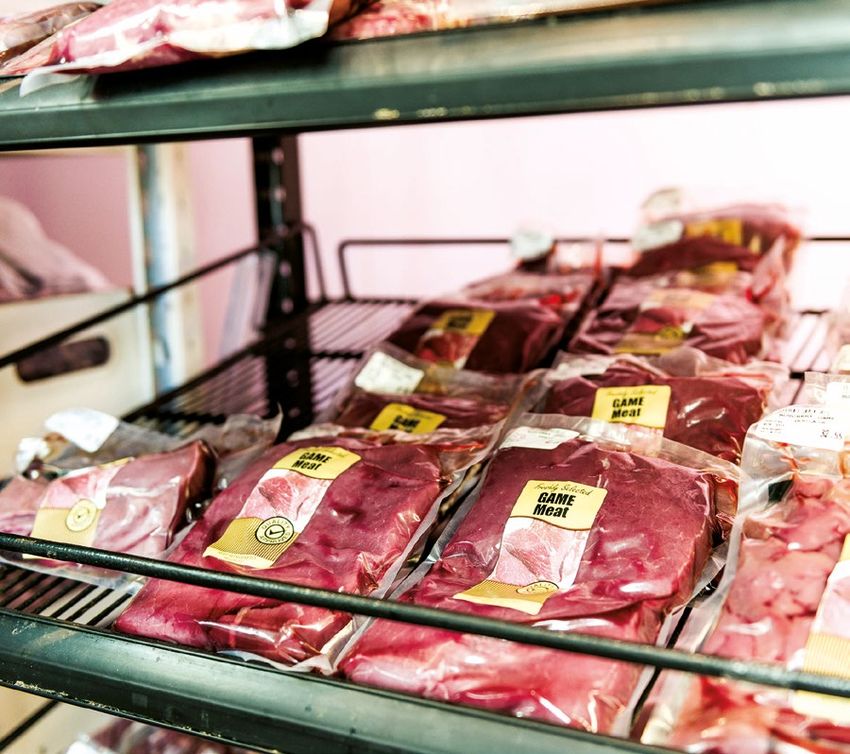
Published by: Ministry of Industrialisation, Trade and SME Development (MITSMED)

Supported by: Deutsche Gesellschaft für Internationale Zusammenarbeit (GIZ), on behalf of the German
		            Federal Ministry for Economic Cooperation and Development (BMZ)

Partially based on: draft final report “Development of a Sector Growth Strategy for the Namibian Agro-
		                  Processing Industry: Game Meat – In-depth Value Chain Analysis and Strategy” by
		                  Optimal Agricultural Business Systems (OABS), April 2016.

Design & Layout by: Juxtapose Design

Photography by: Shawn van Eeden, Creative Lab

                                                         2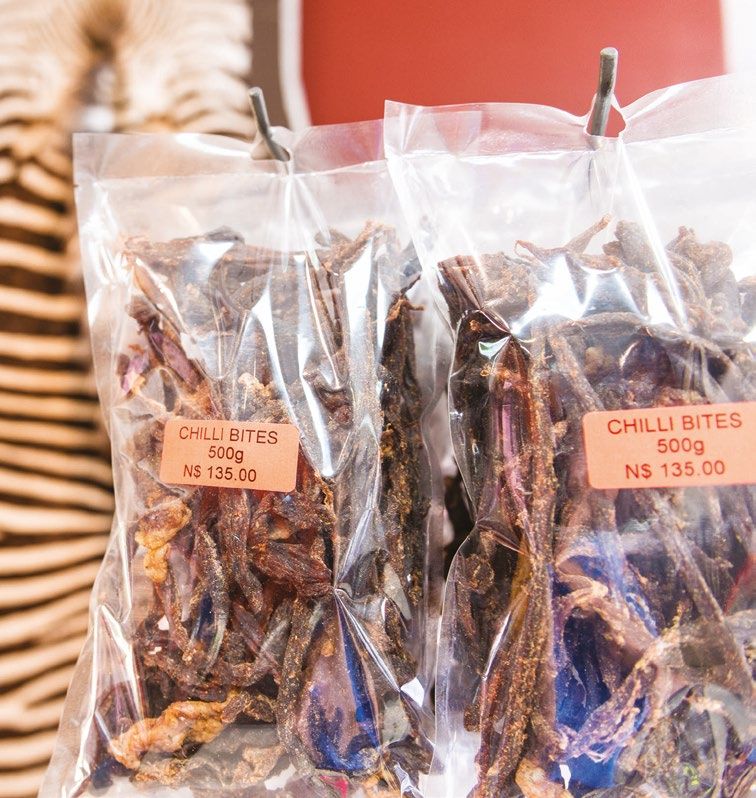
FOREWORD
                                                                  ing forward and backward linkages within the Namibian
                                                                  economy as envisaged in the Harambee Prosperity Plan.

                                                                  Game meat is a strategic industry that has, in agreement
                                                                  with the fourth National Development Plan, been select-         The Industry Growth
                                                                  ed for a more specific focus on its economic develop-           Programme is an
                                                                  ment. Key stakeholders from the business community              important element
                                                                  and public administration who have a vested interest in         of the war against
                                                                  the Namibian industry’s prosperity for the benefit of all       poverty and a
                                                                  have engaged in extensive consultations and substantial-        further step on
                                                                  ly contributed to this programme. They are now eager
                                                                                                                                  Namibia’s path
                                                                  to implement interventions along the value chain effec-
                                                                  tively.                                                         towards becoming a
                                                                                                                                  highly competitive,
                                                                  Many of the suggestions and concerns raised by entre-           industrialised nation
                                                                  preneurs and civil servants in extensive discussions have       with sustainable
                                                                  been distilled into this document. This interactive pro-        economic growth as
The Industry Growth Programme is part of the ongoing              cess has once more demonstrated that Namibians to-              depicted in Vision
efforts to reinforce Namibia’s economic growth, to re-            gether can shape an enabling environment in which the           2030.
duce income inequality and to increase employment for             manufacturing sector can thrive and the wellbeing of the
its citizens. This Industry Growth Strategy forms part of         Namibian people be advanced.
the support to selected manufacturing industries envis-
aged by the Growth at Home strategy, which promotes               I am sure that the Industry Growth Strategies have the
Namibia’s competitive advantages and opportunities.               potential to remove challenges and accelerate economic
This is envisaged through the Special Industrialisation           development in the prioritised areas. The interventions
Programme whose aim is to provide targeted support for            planned for 2016 onwards will allow the targeted indus-
value chain analyses and feasibility studies.                     tries to prosper according to their inherent abilities. This
                                                                  strategy is a living document. As such, additional com-
It is through the implementation of this and other strate-        ments or remarks from stakeholders are welcome and
gies that the Ministry of Industrialisation, Trade and SME        can be addressed to the Ministry of Industrialisation,
Development, in close cooperation with other line min-            Trade and SME Development.
istries, will support local value addition, upgrading and
economic diversification. The efforts will help to struc-         I am confident that, in the vein of the Harambee Prosper-
turally transform Namibia’s economy favouring the most            ity Plan, all stakeholders involved will pull in the same di-
productive and efficient economic activities, and local           rection in the upcoming implementation phase – as they
industries will be provided with improved market access           have done in strategy building – for the advantage of a
at home and abroad.                                               thriving Namibian economy that creates jobs, incomes
                                                                  and sustainable growth.
The Industry Growth Programme is an important ele-
ment of the war against poverty and a further step on
Namibia’s path towards becoming a highly competitive,
industrialised nation with sustainable economic growth            Hon. Immanuel Ngatjizeko
as depicted in Vision 2030. As such, this strategy’s imple-       Minister of Industrialisation, Trade and SME
mentation through 2020 is geared towards strengthen-              Development

                                                              3
TABLE OF CONTENTS
ACRONYMS AND ABBREVIATIONS				                                           5

1. NAMIBIA’S GAME MEAT INDUSTRY AND ITS VALUE CHAIN                      6

  1.1   Industry Definition                                              7
  1.2 Global and Regional Industry Performance                           8
  1.3 Industry Background and Evolution in Namibia                      12
  1.4 Local Industry Performance                                        13
  1.5 Demand for the Products of the Industry                           14
  1.6 Characterisation of Value Chain Operators and Their Functions		   22
  1.7   Classification and Characteristics of Namibian Products         24

2. IDENTIFIED OPPORTUNITIES FOR AND CONSTRAINTS TO INDUSTRY GROWTH      25

  2.1   Primary Production and Input Supply                             27
  2.2 Transformation and Technology                                     27
  2.3 Product Distribution and Trade                                    28
  2.4 Service Delivery                                                  29
  2.5 Business Environment                                              30

3. INDUSTRY GROWTH STRATEGY                                             32

  3.1   Vision of Industry Stakeholders                                 33
  3.2 Industry Growth Indicators                                        33
  3.3 Strategic Objectives, Indicators and Proposed Interventions       33

BIBLIOGRAPHY				                                                        42

                                                          4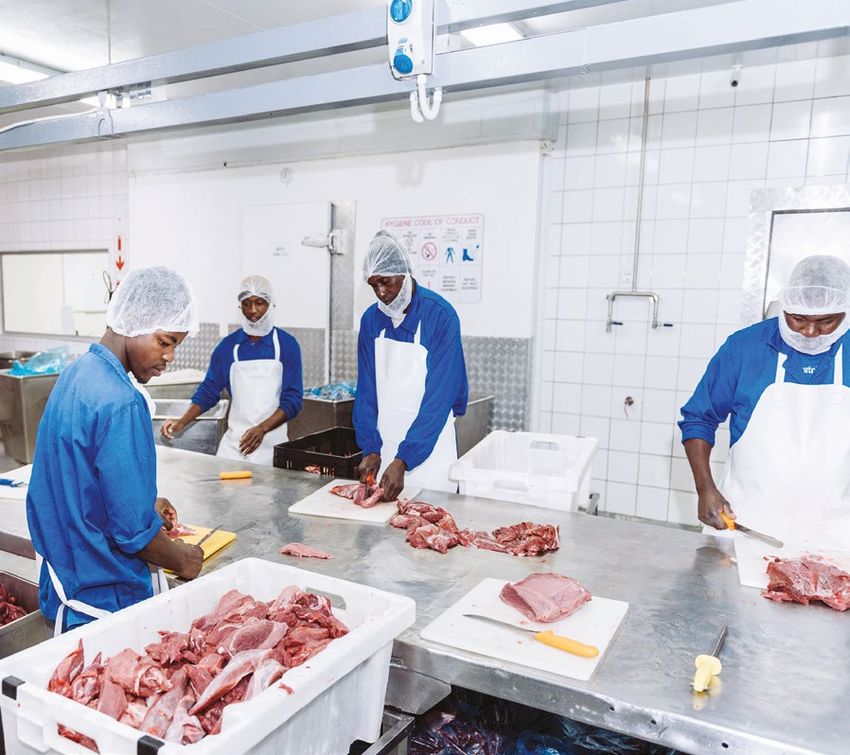
ACRONYMS AND ABBREVIATIONS
CAGR		    Compound annual growth rate
DRC		     Democratic Republic of Congo
DVS		     Directorate of Veterinary Services
EU		      European Union
GDP		     Gross domestic product
HACCP     Hazard analysis and critical control points
HS		      Harmonized Commodity Description and Coding System
ISIC		    International Standard Industrial Classification
ITC		     International Trade Centre
MAWF		    Ministry of Agriculture, Water and Forestry
MBD		     Meat Board of Namibia
MET		     Ministry of Environment and Tourism
MITSMED   Ministry of Industrialisation, Trade and SME Development
MOHSS     Ministry of Health and Social Services
NACSO     Namibian Association of Community Support Organisations
NAD		     Namibia Dollar
NAU		     Namibia Agricultural Union
NEF		     Namibian Employers’ Federation
NMA		     Namibian Manufacturers Association
NNFU		    Namibia National Farmers Union
NSI		     Namibian Standards Institution
OABS		    Optimal Agricultural Business Systems
R&D		     Research and development
RSA		     Republic of South Africa
SOPs		    Standard operating procedures
STEC		    Shiga toxin-producing Escherichia coli
TORs		    Terms of reference
UN		      United Nations
VC		      Value chain/veterinary circulars
VPNs		    Veterinary procedural notices
WRN		     Wildlife Ranching Namibia

                                                  5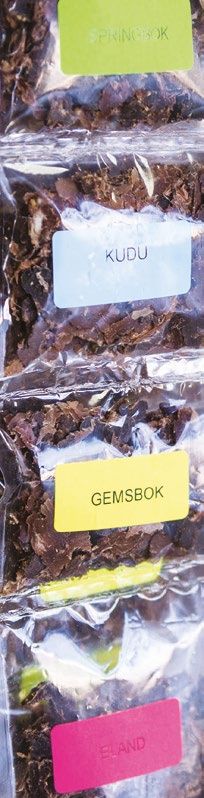
1. NAMIBIA’S GAME MEAT
INDUSTRY AND ITS VALUE CHAIN
1.     NAMIBIA’S GAME MEAT INDUSTRY AND ITS VALUE CHAIN

Game meat production was selected as one of the                   includes all other value chain operations carried out
promising agro-processing industries on which to                  in the field, namely eviscerating and removing heads,
conduct an in-depth analysis of the associated value              feet and red offal in field abattoirs. The Namibian in-
chain. Experience with industrial upgrading processes             dustry uses the term game meat and not venison, as
around the world has shown that value chain analysis              the meat comes from free-ranging game.
is a useful tool that can help identify constraints to
and opportunities for industrial growth. The detected             The industrial segment of the value chain is captured
opportunities and constraints within Namibia’s game               in ISIC Manufacturing Section C, Division 10 (Manu-
meat industry and its value chain were the departure              facture of food products). This comprises all produc-
point for an industry growth strategy, the implemen-              tive activities carried out in registered game-handling
                                                                                                                             NAMIBIA’S
tation of which is expected to make a significant con-            facilities, i.e. abattoirs, butcheries and processing
tribution to the overall goals and targets of Growth at           plants. Most of these economic activities are part         GAME MEAT
Home – Namibia’s Execution Strategy for Industriali-              of Class 1010, which comprises basic and advanced          INDUSTRY AND
sation.                                                           meat-processing activities such as dehiding/deskin-
                                                                                                                             ITS VALUE
                                                                  ning, deboning and the production of fresh, chilled
                                                                  and frozen game meat, whether as carcasses, cuts or        CHAIN
1.1    Industry Definition                                        individual portions, as well as the production of dried,
                                                                  salted or smoked game meat and game meat prod-
The following definition of the game meat industry                ucts such as biltong and droëwors. However, manu-
and value chain is based on the International Stand-              facturing ready-made prepared meals and dishes in
ard Industrial Classification of All Economic Activities          canned or frozen form which also contain ingredients
(ISIC), Revision 4:                                               other than game meat and seasonings (e.g. canned
                                                                  game goulash), would fall under Class 1075: Manufac-
The primary production segment of the game meat                   ture of prepared meals and dishes. Activities related
value chain is composed of two economic activities,               to packaging game cuts and offal, in vacuum bags
game farming and harvesting. Game farming is char-                and cartons according to buyer requirements, are also
acterised by extensive sustainable raising of a wide              part of the industrial segment of the game meat value
range of game species; as a primary production ac-                chain, but these are classified under Section N of ISIC,
tivity, within the ISIC it is part of Division 01 (Crop and       Rev. 4: Administrative and support service activities.
animal production, hunting and related service activi-
ties), Group 01 (Animal production), Class 0149 (Rais-            The distribution and trade segment of the value
ing of other animals), which includes raising game                chain falls under Section G, Division 46 (Wholesale;
animals on ranching operations. Different from game               Class 4630) and Division 47 (Retail). Due to demand
(trophy) hunting, which is considered a sport and rec-            by health-conscious consumers, game meat has de-
reation activity and is therefore classified under Ser-           veloped from its traditional use – being only eaten in
vice Group 9319, game harvesting in Namibia is car-               dried form – to use in a large number of dishes in the
ried out by professional marksmen and is therefore                hospitality industry. As a considerable portion of Na-
a primary activity classified under hunting, trapping             mibian game meat products are currently consumed
and related service activities (Class 0170). This also            in restaurants and lodges, other relevant econom-

                                                              7
ic activities in the distribution segment of the value          According to the latest available FAOSTAT data, the
                      chain include accommodation and food service activ-             share of game in global meat production and consump-
                      ities (ISIC Section I).                                         tion is small, and even smaller in the global meat trade:
                                                                                      Whereas worldwide meat production increased between
                      Hides and skins are by-products of the game meat                2000 and 2013 from 230 million tonnes to more than 310
                      value chain, as they are necessarily produced along             million tonnes, available aggregate estimates show that
                      with meat by slaughtering game. Since both prod-                during the same period, game meat output grew from
                      ucts – meat and hides/skins – have the same origin in           less than 1.6 million tonnes to little more than 2 million
With the rise of
                      terms of their resource bases and locations in which            tonnes (Figure 1). Hence, the compound annual growth
game-farming
                      primary production (game farms) and basic process-              rate (CAGR) of game meat production (1.65%) was lower
activities in the
                      ing (game-handling facilities) are carried out, the pro-        than that of general meat production (2.15%). The niche
second half of the
                      duction of game hides and skins is also classified un-          character of game meat in most parts of the world is also
20th century, game
                      der Class 1010 in ISIC, Rev. 4. However, hides and skins        underlined by the fact that its current contribution to the
meat production
                      are not food products, nor do they belong to the same           world meat supply is only about 0.6%.
and consumption
                      product value chain. In the game leather value chain,
has become relevant
                      subsequent activities in the transformation segment             Though Africa accounted for only 7.5% of global meat
again.
                      are (1) second-stage processing of hides and skins              production in 2013, more than half of the global supply
                      into leather and (2) manufacturing of game leath-               of game meat (56.2%) came from this region (see Fig-
                      er products. This second game-based value chain is              ure 2). All told, the share of game in Africa’s total meat
                      also relevant in Namibia and has been analysed in the           output (17.35 million tonnes in 2013) is 6.5% (1.13 million
                      growth strategy for Namibia’s leather industry and              tonnes), which is significantly higher than in all other
                      associated product value chains (MITSMED 2016).                 major world regions. In fact, in several African coun-
                                                                                      tries, game contributes substantially to the total supply
                      1.2    Global and Regional Industry 		                          of livestock products and to the population’s daily diet.
                                                                                      It is also worth noting that in West and Central Africa,
                             Performance                                              wild meat (“bush meat”) generally fetches higher prices
                                                                                      in urban markets than beef, mutton, pork, goat or other
                      Although in prehistoric times game was man’s sole source        domestic meat.
                      of meat, with the domestication of animals it ceased to
                      be an important food source in most parts of the world.         The world’s largest producers of game meat, accord-
                      With the rise of game-farming activities in the second          ing to FAOSTAT data, are Papua New Guinea (380,000
                      half of the 20th century, game meat production and              tonnes) and the USA (249,000 tonnes), followed by three
                      consumption has become relevant again. However, there           African countries, namely Nigeria (165,000 tonnes), Côte
                      are serious data gaps in the industry’s production and          d’Ivoire (145,000) and the DRC (116,000).
                      trade statistics. Only countries like Namibia with strin-
                      gent hunting legislation tend to register the number and
                      species of hunted and harvested game. Since production
                      statistics are lacking for some developing countries and
                      are based only on food consumption surveys in others,
                      international data on game meat should be considered
                      with a lot of caution.

                                                                                  8
Global Production of Game Meat
                                                               2000-2013
                   2,200k

          tonnes   2,000k

                   1,800k

                   1,600k

                   1,400k
                             00

                                   01

                                         02

                                                 03

                                                        04

                                                               05

                                                                      06

                                                                              07

                                                                                    08

                                                                                          09

                                                                                                 10

                                                                                                        11

                                                                                                               12

                                                                                                                      13
                                                                                                                           NAMIBIA’S

                                                                                                      20

                                                                                                             20

                                                                                                                    20
                                  20

                                                                                               20
                                                                           20
                                        20

                                              20

                                                             20

                                                                                   20
                                                                    20

                                                                                         20
                                                      20
                            20

                                                                                                                           GAME MEAT
                                                                      World                                                INDUSTRY AND
           k = thousand
                                                                                                                           ITS VALUE
Figure 1: Global production of game meat, 2000–2013                                                                        CHAIN
Source: FAOSTAT

                                                   Production Share by Region

                                                 Oceania
                                                   20.1%

                                        Europe
                                            7%

                                          Asia                                                 Africa
                                          1.4%                                                 56.2%

                                          Americas
                                            15.3%

Figure 2: Regional contributions to global production of game meat, 2013
Source: FAOSTAT

                                                                     9
In international trade statistics, game meat cuts (fresh, 020890 (fresh, chilled and frozen game meat) totalled
chilled and frozen) fall under the Harmonized System almost 100,000 tonnes (96,243 tonnes) in 2013 and were
(HS) Code 0208: “Meat and edible meat offal not else- valued at USD 680 million. With total production esti-
where specified”. However, at the four-digit level, game is mated at 2 million tonnes, this means that only about 5%
categorised with meats produced from rabbits, reptiles, of worldwide game meat output is actually traded across
amphibians (e.g. frog legs), primates, marine mammals borders, whereas 95% is locally consumed. Again, this
(whales, dolphins), camels and camelids – which makes share is much lower than for meat in general, with trad-
international comparisons on this aggregation level too ed quantities representing almost half of worldwide pro-
Only about 5% of
ambiguous. At the six-digit level, game meat exports duction in 2013 and valued at about USD 124 billion. This
worldwide game
and imports are also classified under residual HS Code comparison provides further evidence of the niche char-
meat output is traded
020890, but this is much more representative of game acter of game meat as a commodity; it also shows that
across borders,
meat, as it doesn’t include any of the other above-men- game meat tends to be consumed closer to the place of
whereas 95% is
tioned meats. Processed (prepared and preserved) game harvesting and processing than other types of meat. As
locally consumed.
meat products are traded under HS Code 160290(90). outlined in Figure 3, despite temporary setbacks, global
game meat exports have experienced an overall upward
Based on the data submitted by reporting countries to trend in the last 10 years.
the UN Comtrade database, world exports under HS
Global Game Meat Exports
HS 020890, 2004-2014
1000
Exported value, USD thousand
800
600
400
200
0
2004 2005 2006 2007 2008 2009 2010 2011 2012 2013 2014
Years
Figure 3: Global game meat exports (HS 020890) by value (million USD), 2004–2014
Source: Intracen, based on UN Comtrade statistics
10Regarding trade with processed game meat products, former commands a higher price in the targeted export
reported world exports under HS 160290 (Meat pre- markets due to a reputation for superior flavour.
pared and preserved n.e.s.) also totalled approximately
100,000 tonnes (98,431 tonnes) in 2013 and were valued Rising demand for game meat/venison and by-products
at USD 270 million, i.e. about half the value reported for such as hides, skins and velvet antlers (used in the Far
fresh, chilled and frozen game meat exports. East in traditional medicine as an aphrodisiac) has acted
as the most important driver for commercial game farm-
Africa’s huge share in global game meat production ing and slaughtering. Demand for game meat and ven-
stands in sharp contrast to the region’s participation ison tends to follow income increases, even in markets
in international trade in game meat. Only 2,095 tonnes with high overall meat consumption levels, given its dis-
were exported from African countries in 2013, which rep- tinctive flavour and leanness (higher protein and lower
resented no more than 2% of global exports. Global trade fat content than in conventional meats). Like in Namibia
in game meat is dominated by the EU (Poland, Belgium, and South Africa, in other game-meat-producing coun-
Spain, Germany and the Netherlands), New Zealand and tries shooting fees from local and foreign hunters are an NAMIBIA’S
Australia, as well as several Asian countries. The world’s important additional income source for free-range game GAME MEAT
leading game meat (venison) exporter is Poland, with farmers and local conservancies. In the Western Europe-
more than 27,000 tonnes and a 25% share in global ex- an countries, larger socioeconomic and ecological trends INDUSTRY AND
ports (2015), followed by New Zealand (16,600 tonnes; have acted as additional supply drivers. For example, for ITS VALUE
16%). Exports from other EU countries are considerably many years game farming has been actively promoted in CHAIN
lower, but the EU28’s total share in international game economically disadvantaged rural areas in Eastern and
meat exports reaches 66%, while the combined share of Western Europe as a commercially attractive alternative
New Zealand and Australia accounts for an additional to traditional livestock farming. Meanwhile, in Southern
20%. The three major Asian exporters (Indonesia, China Africa, climate change is considered an important indi-
and Vietnam) hold a minor share of 7%. rect supply driver. With the increases in temperature and
decreases in precipitation projected for Namibia, adapt-
The African share in international trade in processed ed species of wildlife are expected to become more im-
game meat products (HS 160290) is low as well: the portant economically than other livestock (cattle, sheep
2,779 tonnes that were reported in 2013 represented and goats).
less than 3% of global exports. However, mainly due to
the strong export performance of South Africa in this As exemplified by South Africa, in countries where game
product category, this has been changing lately; in 2015, farming has been increasing and where game meat pro-
South Africa ranked sixth worldwide, with 4,590 tonnes duction for domestic consumption and for export has
of manufactured game meat products exported worth been successfully combined with hunting activities, these
USD 16 million, representing 16% of global exports in this trends have tended to push up prices for breeding stock,
product category. while the game population increases. Whereas the game
population in traditional-livestock-producing countries
Generally speaking, important game-meat-exporting such as Australia and New Zealand tends to be rather
countries are those where game is commercially farmed small compared with the cattle and sheep populations,
and where conventional meat exports tend to be im- the share of game meat exports in total livestock export
portant as well, as exemplified by world market leaders earnings has been growing and is expected to continue
Poland and New Zealand. The latter country pioneered to do so.
commercial farming of red and fallow deer but continues
to distinguish between wild and farmed venison, as the
111.3 Industry Background and later on an industrial scale. Today, their products can be
found in almost any retail business in Namibia, including
Evolution in Namibia convenience shops at fuel stations. The game-product
manufacturers adapted to changing consumer demands,
Freehold farmers were given commercial rights over as can be seen from changes in the packaging sizes and
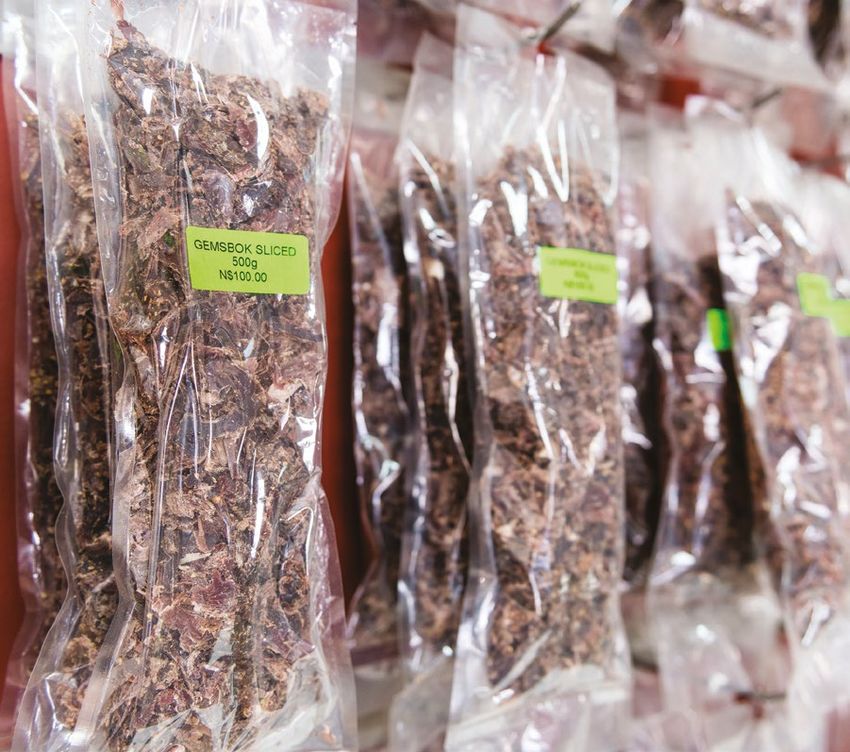
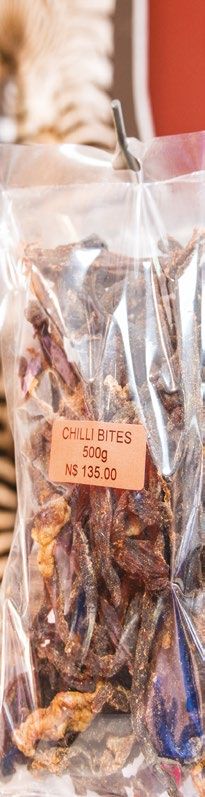
wildlife in 1967; farmers in communal areas received the recipes (e.g. chilli bites for the snack market).
same rights in 1996. Although ownership of game an-
imals is still a contentious issue, as the number that a Namibia has a mixed track record of mostly small-scale
When comparing farmer may take off his land is determined by the Min- attempts to commercially export game meat to interna-
Namibian game meat istry of Environment and Tourism (MET), approximately tional markets. During the early 1990s, Windhoek Wild
and meat products to 90% of Namibia’s wildlife is located outside formally pro- (Pty) Ltd exported kudu, gemsbok and springbok meat
competitor products claimed conservation areas and thus is available for sus- to Switzerland. However, their export plant was closed
from other countries, tainable utilisation. More than 80% of the populations of soon after the Chernobyl accident, which resulted in a
it is frequently the larger game species are located on privately owned perception in Europe that all game meat was contami-
observed that local farms, which comprise about 44% of the surface area of nated with radioactive substances.
products tend to be the country.
superior in taste and Exports of game meat recommenced in 2003 when
appearance. Namibia counts more than 3 million head of game, a fig- Farmers Meat Market Mariental Abattoir (Pty) Ltd was
ure roughly similar to those for cattle, sheep and goats. approved by the European Union to export deboned
Depending on the species, wildlife population generally springbok meat to the EU and Norway. This facility ex-
increases 15–35% per year (Van Schalkwyk and Hoffman, ported 70 to 85 tonnes of deboned springbok meat to
2015). the European markets annually. Another facility in the
south of Namibia, Brukarros Meat Processors (Pty) Ltd,
In the past, game meat was seen as an inferior product received approval for the export of deboned springbok
and given to farm workers as part of their monthly re- meat to the European Union in 2008. Between 2003 and
muneration. The evolution of the health-conscious con- 2008, the overall value of game meat exports almost
sumer seeking meat with a low fat content and a more tripled, from less than NAD 11 million to NAD 31 million;
favourable fatty acid composition than beef or lamb has however, volume-wise, South Africa remained Namibia’s
changed the image of game meat, including on the local principal game meat trading partner. In 2008, from a to-
market. When comparing Namibian game meat and meat tal export volume of 2,100 tonnes, 1,600 tonnes went to
products to competitor products from other countries, it the neighbouring country. After a slowdown between
is frequently observed that local products tend to be su- 2009 and 2012, exports spiked in 2013, when Namibia ex-
perior in taste and appearance, as Namibian game is free ported over 1,000 tonnes of game meat products worth
range and grazing contributes to the meat’s nutrition- more than NAD 50 million to the RSA (740 tonnes), Bel-
al and sensory quality. As Namibia is a drought-strick- gium (105 tonnes), Norway (92 tonnes) and Botswana
en country with dry climatic conditions, limited diseases (102 tonnes). Since 2014, there has been no facility ex-
and conditions are found amongst game, which has also porting meat from game species to overseas markets,
contributed to the popularity of this type of meat. and export activities have been largely confined to small
amounts of processed products (biltong and droëwors)
Biltong and droëwors are traditional products that have going to South Africa, with meat export quantities plum-
been homemade in almost every rural household in South- meting to 86 tonnes in 2014 and 38 tonnes in 2015 (mir-
ern Africa since the 1900s. As more and more women ror data). Though Namibian and South African springbok
started to follow professional careers and had little time meat has become known to some extent in international
left to devote to homemade foods, processors and man- markets, the larger game species’ meat is still mostly un-
ufacturers seized the opportunity and started to produce known overseas.
game meat products on a small commercial scale and
121.4 Local Industry Performance
Namibia’s Vision 2030 foresees sustainable use of the country’s wildlife for its economic benefit. The wildlife sector in
Namibia comprises several industries: breading and live sales of game, safari tourism, trophy hunting and taxidermy
works, commercial game harvesting and meat processing, as well as fabrication of game leather and game leather
products.
Commercial game farming is still gaining importance, not only in the EU, Australia and some parts of Asia but also in There has been
South Africa and Namibia. Given the gradual decline in cattle and sheep production in recent years, game is the only a considerable
commercial livestock system in Namibia that is currently expanding. increase in game
meat production
According to FAOSTAT data, there has been a considerable increase in game meat production in Namibia since inde- in Namibia since
pendence (see Figure 4). However, production was rather stagnant throughout the 1990s. In 2001, annual production independence.
was at approximately the same level as in 1990 and totalled around 3,500 tonnes. From then, it grew continuously until
2010, when it reached 6,400 tonnes. There has been no significant production growth since, with output stagnating at
about 6,500 tonnes from 2011 to 2013 (latest available figures in the FAOSTAT database).
Namibian Production of Game Meat
1990-2013
8k
6k
tonnes
4k
2k
90
10
11
12
13
00
94
96
99
04
98
06
09
95
93
08
92
05
03
97
02
07
91
01
20
20
20
20
19
19
19
19
19
19
19
19
19
19
20
20
20
20
20
20
20
20
20
20
k = thousand Namibia
Figure 4: Namibian production of game meat, 1990–2013
Source: FAOSTAT
Unfortunately, there are no official figures available on the specific contribution of the game meat industry and its val-
ue chain to the Namibian economy. It is estimated, however, that around 50,000 game units are slaughtered in Namibia
annually for meat production (compared to approximately 140,000 head of cattle and 800,000 sheep) and that direct
13employment in the harvesting, processing and manufac- 1.5 Demand for the Products of the
turing segment of the value chain is generating approx-
imately 300 jobs (OABS, 2016). The value of game meat Industry
product sales is estimated at approximately NAD 200
million1 annually, i.e. 10% of total revenue earned from Unlike output figures, which have increased over the last
local and export meat production and processing, val- 15 years, Namibian game meat exports have been incon-
ued at NAD 2 billion (Meat Board, 2015). This would set sistent, with reported quantity fluctuations between less
the industry’s contribution to the GDP at about 0.23%, than 100 tonnes and more than 2,000 tonnes per year
There are strong
as meat processing accounts for 2.3% of the GDP. On a (Figure 5). Even exports to principal debtor countries
indications that the
higher aggregation level, the combined value of wildlife have been fluctuating strongly.
underutilised
use and tourism contributes 3.5% to the GDP (compared
wildlife industry has
to 3.2% for agriculture and 2.4% for fisheries), according South Africa has been Namibia’s only permanent game
a huge untapped
to calculations by the Namibia Statistics Agency (2014). meat trading partner, but volumes exported to the RSA
potential for value
have also been fluctuating greatly (between 35 tonnes
addition and
As mentioned, the industry’s contribution to foreign ex- and 2,510 tonnes per year); with all other regional and in-
diversified income
change earning has weakened considerably since 2013, ternational trading partners, there have been years with
opportunities.
when total exports had reached NAD 53 million in the relevant export activities (i.e. more than 100 tonnes) fol-
game meat category and NAD 11 million in the category lowed by years with hardly any exports at all.
of preserved game meat products, with exports totalling
1,500 tonnes – almost 25% of total game meat output. This is the case for Belgium, Norway, Switzerland, the
It is expected that in the medium term, export earnings UK and the USA internationally and for the DRC, Zim-
will return to this level if the present export obstacles are babwe and Botswana in the regional sphere. Whereas in
effectively tackled. some years (e.g. 2003, 2006–2008 and 2013) up to half
of game meat production was marketed abroad, in other
Furthermore, game meat is a significant contributor to years almost the entire output was locally marketed and
food security and livelihoods in rural Namibia, as more consumed.
than 33,000 farm workers and their families profit ei-
ther directly or indirectly from game farming, harvesting Such strong fluctuations indicate a general lack of
and hunting activities. There are strong indications that well-established, long-term supplier–buyer relationships.
the underutilised wildlife industry has a huge untapped The absence of permanent export opportunities and
potential for value addition and diversified income op- trade channels is also detrimental to the industry’s over-
portunities, especially for communal conservancies in all growth perspectives.
Namibia as climate change looms (Turpie et al., 2010),
provided that current constraints to industry growth can As previously mentioned, Namibia’s game meat exports
be effectively addressed. Investments in game produc- were reported at 1,046 tonnes in 2013 and valued at NAD
tion, harvesting and processing are welcome, as they will 53 million (NAD 50,800/tonne), and exports of processed
open new opportunities for employment, poverty reduc- game meat products were reported at 456 tonnes and
tion and wealth creation in Namibia (Van Schalkwyk et valued at NAD 11 million (NAD 24,500/tonne).
al., 2012).
1 This estimate is based on an average game meat and meat product unit value of NAD 30,000/tonne and a
total annual production of 6,500 tonnes.
14Namibian Game Meat Exports
HS 020890, 2001-2014
3.000
2.500
Exported quantity, tonnes
2.000
1.500
1.000
500
0
2001 2002 2003 2004 2005 2006 2007 2008 2009 2010 2011 2012 2013 2014
Years
World
Figure 5: Namibian game meat exports, 2001–2014, by volume
Source: Intracen, based on UN Comtrade
That year, the country accounted for half of all African ex- plummeting from 1,046 tonnes in 2013 to 86 tonnes in
ports and ranked 16th on the list of leading game-meat- 2014 and 38 tonnes in 2015 (mirror data). Exports of
export nations volume-wise. The largest export share processed products have dropped as well, though less
went to the RSA (740 tonnes of game meat cuts and 357 dramatically (from 456 tonnes in 2013 to 209 tonnes in
tonnes of processed products), but relevant quantities 2014; no data are available for 2015). It is estimated that
of game meat were also exported to markets where Na- Namibia is currently losing more than NAD 30 million an-
mibian products were fetching higher unit values, name- nually alone by not exporting to the EU.
ly Belgium (105 tonnes) and Norway (102 tonnes).
By contrast, regional competitor South Africa has had
Reported export volumes for 2014 and 2015, however, re- a successful export performance in recent years: where-
veal a sharp downturn in Namibia’s export performance as in 2013, the country ranked second after Namibia on
in both product categories, with game meat exports the list of major African game meat exporters, with a re-
15ported export volume of 786 tonnes, the South African ny (19.9% of global imports by value), Belgium (13.4%),
game meat industry was able to grow its exports to 1,909 France (10.9%) and the Netherlands (9.5%). Other rele-
tonnes in 2015 (out of regional exports totalling 2,156 vant markets are Switzerland (8.2%) and the USA (7.2%).
tonnes) and currently ranks 14th worldwide in terms of
quantity and 13th in terms of value, with export earnings Generally speaking, more profitable consumer markets,
totalling NAD 190 million in 2015. Meanwhile, Namibia has with higher import unit values, tend to be those where
become South Africa’s most important trading partner prices for conventional meats are higher and less sub-
for game meat imports (641 tonnes in 2015; a six-fold in- sidised, since this tends to allow game meat to fetch a
Exporting game meat
crease since 2014); value-wise, the major contributors to higher premium over the prices of beef and lamb. Since
has been facilitated
South Africa’s game meat export earnings in 2015 were the Namibian game meat industry exported relevant vol-
by relatively liberal
Germany (224 tonnes valued at NAD 223,000/tonne), umes of raw meat cuts for several years to the European
import policies in
Belgium (207 tonnes at NAD 186,000/tonne) and the Union and Norway, it has proven its capacity to meet in-
the major meat-
Netherlands (265 tonnes at NAD 149,000/tonne). ternational standards and supply this highly competitive
importing countries.
market.
A similar trend can be observed in the biltong and
droëwors product category, where South Africa grew Exporting game meat has been facilitated by relatively
its exports from 1,862 tonnes in 2013 to 4,843 tonnes in liberal import policies in the major meat-importing coun-
2015, thus becoming the regional export champion (re- tries. By and large, the same animal health regulations
gional exports: 5,000 tonnes) and number six worldwide. were applied to game as to other meats. Along with tariff
duties generally lower than those for conventional meat
The different performances of Namibia’s and South Af- imports, this made it relatively easy and attractive in the
rica’s game meat industries in recent years can be ex- past for countries free of major animal diseases like Na-
plained to a great extent by the end of Namibian game mibia to export game meat, especially when they already
meat exports to the EU; however, the changing trade re- had export-approved meat-handling facilities.
lationship with South Africa (from a net exporter to a net
importer position in both product categories) suggests So far, no duties or levies are payable to markets in the
that the Namibian game meat industry faces a major RSA and the EU. However, the increasing large-scale pro-
competitiveness challenge. duction of game meat in the major consuming countries
has exerted price pressures on worldwide game meat
As previously outlined, the international trade in game exports, at least in real terms. While this contributed to
meat and game meat products is relevant and still shows bringing game into the reach of a broader consumer
modest growth rates. The European Union alone import- segment, increasing sales and trade volumes, it has also
ed about 66,500 tonnes of game meat valued at USD affected the overall profitability levels in the industry.
534 million in 2014 and 123,650 tonnes of processed
game meat products worth USD 375 million. This makes Regional demand for game meat products is also on the
Europe by far the most important consumer market for rise, as the middle class in Africa is growing and gaining
game meat products, with a current share in global im- more purchasing power to spend on items such as meat
ports of 76.2% by value. and meat products. For example, the popularity of dried
game meat products at sport events is contributing to
Given the simultaneous importance of Europe as a game this overall trend. The trend can also be seen in South
meat supplier, regional consumer demand is satisfied to a Africa, where the industry has successfully started ex-
great extent by local production and intraregional trade. porting game meat and game meat products to other
Within the EU, the major importing countries are Germa- African countries such as Mozambique, Lesotho, Gabon,
16Nigeria, Botswana, Congo, Zimbabwe, Angola, the DRC 1.6 Characterisation of Value Chain
and Tanzania recently.
Operators and Their Functions
Namibia’s domestic market is relatively small, consider-
ing that the country has a population of only approxi- The businesses involved in the game meat value chain
mately 2.5 million. Until recently, there has been no com- are spread throughout Namibia and not concentrated in
petition for fresh, chilled and frozen game meat cuts on regional production clusters. However, the operators in
the local market. However, as outlined above, for raw the different value-chain segments tend to interact fre-
cuts and processed game meat products, South African quently, as they recognise their interdependence. The
competitors are now successfully selling to Namibia and following are considered the main operators in the value
other countries in the region. chain:
The most relevant consumer segments, which all the • Primary producers (game farmers who supply the
products serve, are private households and the food ca- animals) NAMIBIA’S
tering and hospitality industry, i.e. restaurants and lodges • Game harvesters (who remove the animals from the GAME MEAT
catering to both local costumers and tourists. veld by shooting them)
• Game meat handlers/abattoirs (who deskin or INDUSTRY AND
Despite this mixed overall record, experts agree that dehide, debone, cut, pack and store raw meat) ITS VALUE
game meat production in Namibia has not reached its full • Game meat processors (who manufacture value- CHAIN
potential yet, assuming demand continues to rise, par- added game meat products)
ticularly from discerning customers looking for a healthy • Game meat traders and wholesalers
alternative to conventional meats and for an ethical and • Retailers and restaurants (who sell to end
ecological alternative to industrial factory farming. Fur- consumers)
ther investments in game production, harvesting and
processing for the local and export markets are there- Figure 6 depicts the game meat value chain with all
fore welcomed and needed, as they will open more and relevant operators on the micro level (direct stakehold-
more opportunities for sustainable use of local wildlife ers), the meso level and the macro level (indirect stake-
resources, employment and wealth creation. holders).
Primary Production (Game Farming and Har-
vesting)
Input suppliers in the game meat value chain are farm-
ers who either have mixed farming with both game and
sheep or cattle or specialise in game farming.
Table 1 presents the estimated game numbers of
commercially harvestable species in different regions in
Namibia. Major game species for meat production are
gemsbok, springbok, kudu, Hartmann’s mountain zebra
17Micro Meso Macro
Direct Stakeholders Indirect Stakeholders
Operators Service Providers Enablers
Functions Foreign Foreign consumers
consumers in Namibia Local consumers
(RSA, etc.) (tourists)
(regulations)
Namport
EU, RSA
86t (2014)
other
NamPower
Activities Foreign agents Local food catering industry
Distribution and retailers and restaurants
MIT SMED
(Wholesale, Laboratories
Retail) (pest control)
Transport,
Game Meat Local wholesalers
NAMIBIA’S repackaging,
preparation,
Traders and retailers
quality control
GAME MEAT Suppliers
of other
until 2013 inputs
INDUSTRY AND Manufacturing
(e.g. spices;
Manufacturing Biltong, packaging
ITS VALUE of value-added
products (drying,
droëwors
etc. Local materials)
Meat product butchers
CHAIN salting, smoking,
etc.); wholesale and manufacturers
(e.g. Closwa, Hartlief)
Financial Service Providers
retail packaging,
marketing, quality Fresh,
MOHSS
control chilled and frozen Equipment
game meat cuts suppliers
De-skinning (small (approx. (meat
6,500 t)
game) & de-hiding processing)
(MAWF)
Off-farm
(large game),
DVS
Processing Specialized
deboning and game meat handlers (abattoirs)
cutting into primal (e.g. Brukarros)
cuts; packaging Providers of
(vacuum bags and maintenance
cartons), chilling and repair
or freezing; quality Formal Informal services
control
Formal, large scale:
On-farm Harvested
Shooting from game (approx. Harvesting
Processing harvesting vehicle, 50,000 units Equipment
field evisceration, p.a.) suppliers
transport to field
abattoir, removal of Registered, large scale game harvesting teams
(professional marksmen) (e.g. Koës, Mos-Mar)
feet, heads and red
offal, cooling and Farmers
WRN
transport to handler
MET
Production of live
Primary animals (major
Production game species for
meat production:
gemsbok, Commercial, Commercial, Communal &
springbok,
NAU
specialised mixed emerging
kudu, mountain in game (cattle etc.) (mixed)
zebra and red
hartebeest).
Figure 6: Value chain map game meat
Source: GIZ ProCOM, based on OABS, 2016
18and red hartebeest. Quotas, as issued by the MET, are usu- imately 4,000 springboks and 2,000 large game units
ally based on 10–20% offtake of the population numbers. annually. The Koës harvesting team has a turnover of 150
All game is sourced locally; no foreign game carcasses are tonnes annually.
brought in from neighbouring countries for processing.
The harvesting teams usually enter into contracts with
Game is usually harvested by professional marksmen. game meat handlers for the months May to August (win-
Only a few well-organised game-harvesting teams in Na- ter months and the official season for night culling) to
mibia are registered with the MET. These are contracted supply game, with fixed numbers of carcasses to be
by the major game meat handlers to harvest on a larg- delivered and fixed prices. Day harvesting is allowed
er scale. The Mos-Mar harvesting team delivers approx- throughout the year (Van Schalkwyk and Hoffman,
Table 1: Regional distribution of commercial game species in Namibia NAMIBIA’S
Oshikoto/
GAME MEAT
Erongo Hardap //Kharas Khomas Kunene Omaheke Otjozondjupa Oshana/ Total INDUSTRY AND
Omusati
ITS VALUE
Springbok 38 234 332 946 239 470 71 491 14 409 25 683 35 769 4 623 762 635
Gemsbok 66 057 111 764 32 970 83 460 36 155 41 093 119 230 11 599 502 328 CHAIN
Kudud 52 150 60 962 29 500 52 756 41 093 141 089 17 567 449 199
Warthog 52 585 37 515 2 603 78 931 30 129 72 279 139 765 9 666 423 472
Red Hartebeest 8 474 35 170 3 471 54 023 5 764 39 258 38 419 1 849 186 428
Elan 4 129 2 345 7817 117 8 646 7 705 56 303 2774 89 798
Harmann Zebra 11 299 22 665 868 17 468 9 956 1 834 13 910 3 194 81 195
Blue Wildebeest 1 304 17 976 1 041 11 646 5 764 6 971 29 145 1 849 75 696
Ostrich 1 521 15631 11 366 8 087 4 391 7 705 19 209 1 409 69 320
Common Impala 3 107 7 034 0 8 411 2 358 6 971 33 120 756 61 757
Black Wildebeest 1 956 6 253 781 10 675 1 834 8 439 15 434 588 45 959
Waterbuck 43 1 563 347 4 205 1 310 8 806 12 254 420 28 949
Plain Zebra 435 3 908 0 4 432 576 2 201 7 949 185 19 686
Black Face Impala 326 1 563 434 2 201 972 7286 706 13 488
Sable antelope 0 0 0 0 157 73 1 987 50 2 268
Lechwe 0 0 0 0 79 0 795 25 899
Tsessebe 0 0 0 0 629 0 66 202 897
Roan antelope 0 0 0 0 629 0 66 202 897
Total 241 628 657 295 323 631 412 027 179 112 271 083 672 063 577 464 2814 304
Source: Lindsey, 2012
192015). Numbers, species, quality and price are then fixed days (the product is kept in a refrigerated truck) due to
to allow game farmers, harvesters and handlers to plan the distances involved.
and budget. It is, however, a challenge for harvesters to
obtain the necessary permits in time, as the MET only There is a trust relationship between sellers and buyers
accepts applications as from April and develops a back- of the raw product, as they are dealing with a biological
log. Harvesting teams usually need between one and two product where a lot can go wrong, especially during the
hours to fill in all the necessary information on checklists harvesting process. The usual means of communication
as required by the MET and DVS. is by phone, as e-mail is often unavailable in remote ar-
eas. Frequency of personal contact is minimal, however,
All inputs into the process need to be transported; trans- due to the large distances between suppliers and buyers.
port costs amount to approximately 15% of the sales The trustful relationship enables efficient business trans-
price. Delayed deliveries can be estimated at 2%. The actions.
value of loss as a percentage of delivery value has been
NAMIBIA’S estimated at less than 1%. At the game-handling facility, carcasses are deskinned
GAME MEAT (small game) or dehided (large game), deboned and cut
The game animals are shot from a harvesting vehicle, into primal cuts. Cuts and red offal are packed in vacuum
INDUSTRY AND field eviscerated and loaded onto the vehicle. The white bags and cartons, which are either chilled or frozen ac-
ITS VALUE offal is usually left in the field for predators. The vehi- cording to the requirements of the customer. The capac-
CHAIN cle then takes the carcasses to the field abattoir. There, ity to formally and hygienically dress and debone game
the heads and feet are removed, as well as the red offal, carcasses in Namibia is limited to a few companies.
which is placed in plastic bags and hung next to the cor-
responding carcass. Later, the carcasses are cooled in a The largest stakeholders in the industrial segment of
refrigerated truck (when large numbers have been har- the game meat value chain, i.e. meat handlers and meat
vested), which also transports them to a game-handling product manufacturers, are Brukarros Meat Processors,
facility. Closwa Biltong, Hartlief, Namaqua Meat, Simondeum and
Beefcor Meat Suppliers. All these companies are under
Aside from the professional harvesting teams engaged Namibian ownership and operate nationally, except for
in formal harvesting and input (carcass) supply, there is Closwa Biltong and Hartlief, which also export a small
also a significant amount of informal trade, with game portion of their output to South Africa. Their combined
farmers delivering carcasses directly to their local butch- market share adds up to around 80%. No foreign direct
eries. These carcasses are often transported in unrefrig- investment is known of in the game meat industry.
erated trucks, which might cause food safety and quality
problems. As core competencies of these companies, quality man-
agement (food safety management and quality-control
Meat Processing and Meat Product Manufac- systems), branding (strong brand positions in the mar-
ket) and generation of sustainable profits through good
turing financial management can be mentioned. The exporting
companies must adhere to the standards and require-
Partially eviscerated game carcasses are supplied by the ments of the importing countries and foreign buyers.
game-harvesting teams either to the game meat han-
dlers (abattoirs) or directly to processors (meat product
manufacturers). Carcass delivery time varies greatly and
can be anywhere from six to 12 hours, or even up to two
20Distribution and Trade The primary producers of game in Namibia are part of
organised agriculture, i.e. the Namibia Agricultural Union
and the Meat Board of Namibia. However, the breeding,
Chilled and frozen game meat cuts and trimmings are ei- harvesting and processing of game for commercial meat
ther directly sold by game handlers who assume whole- production is not addressed by these organisations. Pri-
saler functions to retailers and restaurants or sold from mary producers have recently established an organisa-
handlers to a meat product manufacturer. Companies tion called Wildlife Ranching Namibia that to some ex-
selling game meat to one another usually do not con- tent deals with the breeding of game.
clude formal contracts; rather, orders are placed verbally
or in writing. Currently, several regulations apply to the sustainable
use of game. These are also applicable when game is har-
The industry stakeholders prefer not to make use of vested and processed for commercial meat production.
agents in the distribution chain, as this can become very
costly. However, larger retail companies and chains are Game meat production in Namibia is regulated by the NAMIBIA’S
seen as agents of a kind, as it is very difficult to sell high Ministry of Environment and Tourism (MET) through the
volumes of product without supplying them. GAME MEAT
Nature Conservation Ordinance No. 4 of 1975, as amend-
ed. As per this ordinance, game harvesters must be regis- INDUSTRY AND
The informal game meat trade in Namibia – although its tered with the MET and must apply for a harvesting per- ITS VALUE
share of the total trade in game meat and meat prod- mit when they want to remove game for the commercial
ucts is not easy to quantify – is considered significant, as CHAIN
meat value chain. In addition, harvesting teams and meat
everyone knows someone on a farm and receives game processors must comply with the regulations and guide-
meat from the farm from time to time. lines of the Directorate of Veterinary Services (DVS) of
the Ministry of Agriculture, Water and Forestry (MAWF)
Indirect Stakeholders (Meso and Macro Level) and with the Ministry for Health and Social Services
(MOHSS). Food safety requirements, such as the main-
tenance of the cold chain, must be adhered to through-
At the meso level, relevant operational service providers out the value chain, and production processes must be
that feed into the different value chain segments include: adjusted in order to sell the product, both on the local
suppliers of additional production inputs (e.g. spices; market and abroad. Other relevant acts, regulations and
packaging materials; cleaning chemicals) and equip- regulatory requirements applicable to the game meat in-
ment, such as rifles and other game-harvesting sup- dustry and its value chain comprise the Public Health Act
plies (knives, sterilisers, clothing, etc.); manufacturers of No. 36 of 1919, the Animal Health Act No. 1 of 2011 and its
customised game-harvesting vehicles and refrigeration regulations, Prevention of Undesirable Residues in Meat
trucks and providers of maintenance and repair services; Act No. 21 of 1991 as amended, the Animal Protection Act
providers of laboratory and pest control services; pack- No. 71 of 1962 as amended and veterinary circulars (VC).
aging service providers; and suppliers of meat-process- Administrative requirements producers must meet in or-
ing equipment. Basic service providers include NamWa- der to produce and export products include processing
ter (for water supply) and NamPower (for electricity), and export licenses as well as export permits. The future
and financial services are provided by different commer- development of the industry is also influenced by region-
cial banks. al and international regulatory framework conditions. For
exports to the RSA, the following South African require-
ments to hygiene-management systems and control pro-
cedures based on the HACCP (Hazard Analysis and Crit-
21ical Control Points) principles must be adhered to: the concerning frozen food of animal origin intended for
Meat Safety Act No. 40 of 2000; red meat regulations human consumption (day of production is day of
(17 September 2004); and veterinary procedural notices killing)
(VPNs) and standard operating procedures (SOPs). • Council Directive 98/83/EC, on the quality of water
intended for human consumption
For exports to the European Union (EU), the following • Council Directive 2002/99/EC, establishing the
list of EU directives and regulations have an important animal health rules governing the production,
influence on the industry’s future growth performance: processing, distribution and introduction of products
of animal origin for human consumption (as amend
• Commission Regulation (EU) No. 178/2002, setting ed)
the general principles and requirements of food law, • Council Directive 2003/99/EC, on the monitoring of
establishing the European Food Safety Authority zoonosis and zoonotic agents.
and laying down procedures in matters of food safety
NAMIBIA’S • Commission Regulation (EU) No. 1441/2007,
amending parts of Regulation No. 2073/2005 on Costs and Margins
GAME MEAT microbiological criteria for foodstuffs
INDUSTRY AND • Commission Regulation (EU) No. 2073/2005, on The price a game farmer receives for the product lies be-
microbiological criteria for foodstuffs (as amended) tween NAD 15 and NAD 18 per kg, which yields a gross
ITS VALUE margin above 50%. In South Africa, game farmers receive
• Commission Regulation (EU) No. 2075/2005, laying
CHAIN down specific rules on official controls for Trichinella more for their product, but unlike in Namibia, ex-produc-
in meat (as amended) er prices include harvesting and transport; additionally,
• Commission Regulation (EU) No. 854/2004, laying the distances the trucks need to travel in South Africa are
down specific rules for the organisation of official much shorter than in Namibia.
controls on products of animal origin intended for Harvesting-related costs are significantly higher than
human consumption (as amended) farming costs, as the game harvesters have to buy and
• Commission Regulation (EU) No. 852/2004, on the maintain harvesting vehicles, structures for field abat-
hygiene of foodstuffs (as amended) toirs, refrigerated trucks, etc. Prices received for harvest-
• Commission Regulation (EU) No. 853/2004, ing services vary between NAD 10 and NAD 13 per kg,
establishing specific hygiene rules for food of animal which generates a gross margin of approximately 30%.
origin (as amended)
• Commission Regulation No. 10/2011, on plastic Both the investment and operational costs for a
materials and articles intended to come into game-handling facility are substantial. A minimum invest-
contact with food (as amended) ment of NAD 20 million is required to construct a facility.
• Commission Regulation (EU) No. 206/2010 of The selling price (ex-handling facility) of raw deboned
12 March 2010, laying down lists of third countries, game meat is usually between NAD 40 and NAD 50 per
territories or parts thereof authorised to introduce kg, with a gross profit margin of 20%.
certain animals and fresh meats into the European
Union and the veterinary certification requirements Manufacturing game meat products such as biltong also
(as amended) requires huge capital and operational costs, approxi-
• Commission Regulation (EU) No. 16/2012 of mately NAD 10–20 million per plant. The ex-factory price
11 January 2012, amending Annex II to Regulation is usually between NAD 100 and NAD 300 per kg, gen-
No. 853/2004 of the European Parliament and erating a gross profit margin of 26–30% for the manu-
of the Council regarding the requirements facturer.
22Game Biltong
100
N$/kg Product price
per Kg
300 N$
(biltong, retail)
100
N$/kg
Value addition by the VC 200 N$
(kg biltong,ex
Other inputs/operational services factory: 2 kg raw
debobed meat NAMIBIA’S
Intermediat product input / 50%
weight loss) GAME MEAT
Value added INDUSTRY AND
ITS VALUE
Retail CHAIN
20
Manufacturing N$/kg
50 N$
12 (raw deboned
N$/kg meat)
Processing
18
N$/kg 30 N$
(carcass)
Harvesting
18 N$
(shot animal)
Primary Production
Game Game Game Biltong Retailer
Farmer Harvester Handler Producer
Gross 50% 30% 25% 30% 25%
Margin (9 N$) (3.6 N$) (4 N$) (30 N$) (75 N$)
Figure 7: Value addition and gross profit margins along the game meat value chain
Source: GIZ, based on data from OABS 2016
23In Figure 7, an ex-factory price of NAD 200 has been ap- The fat percentage is less than 3%, which is much lower
plied to biltong; the retail price of the finished consumer than that of other commercial livestock. When cooked
product is NAD 300 per kg. The diagram shows the val- or fried, game meat has a very distinctive taste. Quali-
ue-addition processes along the value chain and gross ty-wise, Namibian game meat is a superior product. Av-
profit margins obtained by the different chain operators. erage live and carcass weights compare favourably to
the same product in South Africa. Due to the grazing on
natural pastures, the meat quality is also superb and ap-
1.7 Classification and Characteristics plauded by consumers from all over the world.
of Namibian Products
Dried meat products comprise mainly game biltong and
The current products of the game meat value chain in game droëwors. About 50% of the weight is lost when
Namibia are raw game meat cuts and dried game meat the game meat is dried. Due to the spicing and preser-
products, namely game biltong and droëwors. vation, a very distinctive taste develops. Dried meat is
NAMIBIA’S considered a safe product, as it is high in salt and has low
GAME MEAT Raw game meat cuts are perishable and therefore ei- water activity. It can also be stored and sold at ambient
ther kept chilled (You can also read


