Extreme Convective Weather in Future Decades - University of ...
←
→
Page content transcription
If your browser does not render page correctly, please read the page content below
Extreme Convective Weather in Future Decades

Alan Gadian*, James Warner, Ralph Burton, James Groves, Alan
                  Blyth and Stephen Mobbs
                NCAS, University of Leeds, UK

     Greg Holland, Cindy Bruyere, James Done, Mari Tye
                     MMM , NCAR, USA

                        Jutta Thielen
             Climate Risk Management Unit, JRC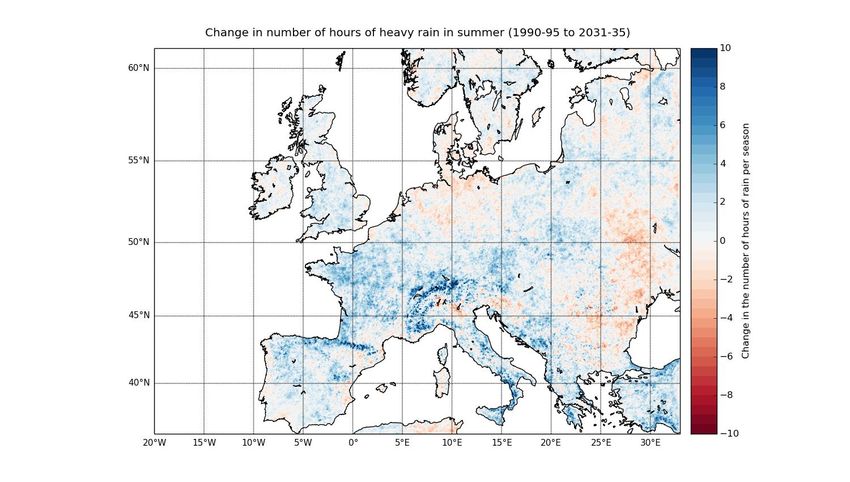
Domain construction
The model is driven by ERA-Interim and CCSM surface and North / South lateral boundaries.

  Domain structure for the WISER simulation. The outer domain resolution is
  20km at +/- 30° and 8km at 68° N/S. The inner domain is nested at a ratio of
 2
  5:1
Progress … summer 2016 (40 million core hours on a Cray XC30 )
Years 1989 – 1995

• Control simulation driven at the boundaries by ERA-Interim data.
• “Climate” simulation driven at the boundaries by CCSM data.
Objective: To compare the “climate” and the “analysis” driven data.
Data from 1989 are ignored as spin-up and only the 6 years 1990 – 1995
used for comparison purposes.

Years 2020 – 2025 and 2030 – 2036
“Climate” simulation driven at the boundaries by CCSM data
•2021 – 2025
•2031 – 2036

Objective: To compare the differences in weather scale data for five
years of weather data, 2021 – 2025 and 2031 – 2036. Data from 2020 and
2030 are ignored as spin up.

3
Summary.

         The WISER project is designed to look at changes in weather patterns
    (a) over recent decades, and (b) the future weather in a regional
    framework. It uses WRF 3.5.1 in a convecting permitting formulation for
    the inner domain.

        The resolution (~3km) is required to resolve weather patterns needs
    high resolution, reducing the errors / upscaling limitations.

          The project involves collaboration with the US National Centre for
    Atmospheric Research (NCAR) and the European Flood Awareness
    System which is based at the EU Joint Research Centre (JRC), ISPRA,
    Italy.

        The 900 Tbyte netcdf data set will be available for open access.

        The project has used more than ~ 40 million equivalent Cray XC30
    core hours (500 Megawatt hours of electricity).

4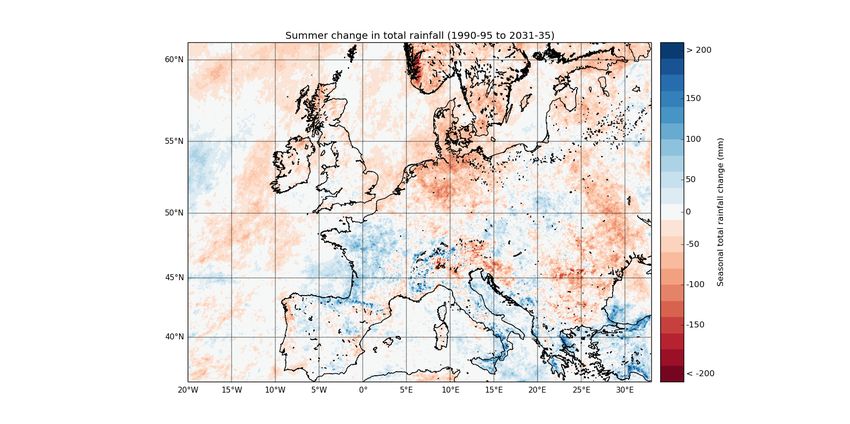
Objectives and specific outcomes •Predicted changes in quantity and frequency of severe and hazardous convective rainfall events. The frequency of flash flooding due to heavy convective precipitation. Links to be examined with JRC for flooding. Predicted changes in general precipitation over Western Europe and the UK over decadal timescales. Predicted changes in patterns of frontal tracks on decadal time scales and to examine the strength, the frequency and the location of Western Atlantic storm tracks for historical and future simulations. Past and predicted occurrence of blocking in the North Atlantic Changes in meso-scale cloud structure patterns
Comparison of current and future
           precipitation patterns for the UK.

           Panel (a) indicates the UK rainfall
           amounts for summer (JJA) 1981-
           2000. Panel (b) indicates the UK
           rainfall amounts for summer (JJA)
           1990-1995. Panel (c) indicates the
           values with the outer domain D01
           driven by the ERA Interim data and
           Panel (d) driven by CCSM DATA for
           1990-1995. Panel (e) shows the        (b)
(a         model data for years 2031-2035
)          driven by CCSM data.
             .

     (c)                      (d)                      ( e)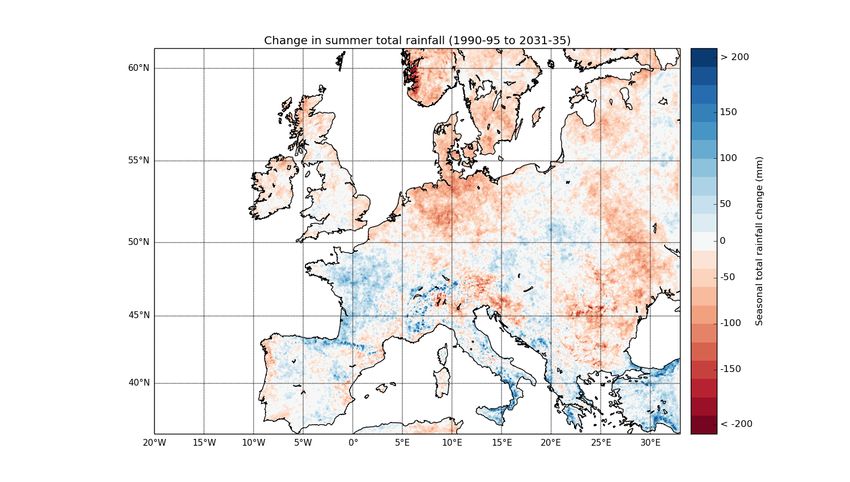
Upper right plot: Changes in mean hourly
Upper left plot: Changes in maximum hourly        precipitation rates for rainfall events for the UK
precipitation rate per day, for UK in the inner   in the inner domain (d02) ~ 2km. Note
domain (d02) ~ 2km. Note differences are values   differences are values (mm/hr) 2031-35 minus
(mm/hr) 2031-35 minus 1990-95. (JJA)              1990-95. (JJA)

 Lower plot: Change in precipitation in 12km and 1.5 km model simulation. Differences for
JJA in precipitation, (mm/hr) between 2100 and current values. The displayed area
represents the whole inner domain. Kendon et al. NCC, (2014)

 13
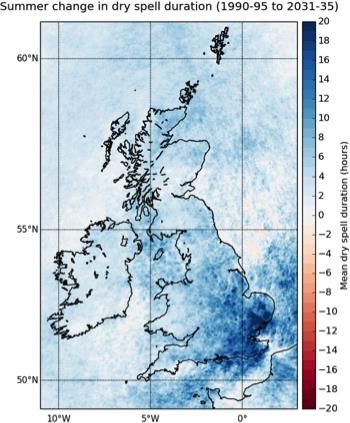
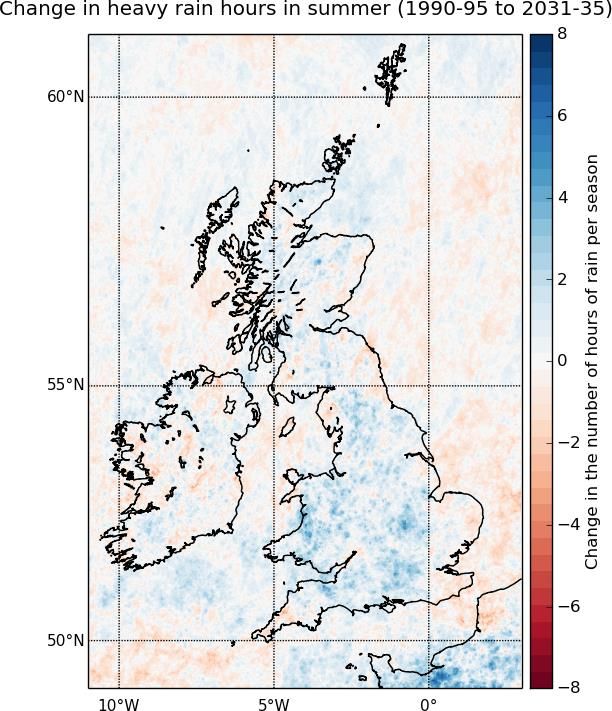
Summer, JJA, (UK) changes
(a    in dry spell, Panel (a) and
)     wet spell duration, Panel (b).           (b)
      Panel (c): change in heavy
      rain (> 7.6mm/hour).
      All changes are produced by
      subtracting the 1991-1995 from
      the 2031-2035 average values
      at each pixel.
      In Panel (c) the number of
      hours of heavy precipitation per
      event increases by ~ 2 hours,
      indicating when it rains, it rains .
      harder.

(c)   Panel (d) summarises these
      results by plotting the                 (d)
      maximum precipitation against       .
      the duration of the each event.
      A critical result. In the future
      scenarios, there are shorter
      bursts of heavier rain. A
      significant increase in
      precipitation in relatively short
      ~2 hours rain events is at the
      expense of longer (~ 4 hours)
      lower rainfall rate events.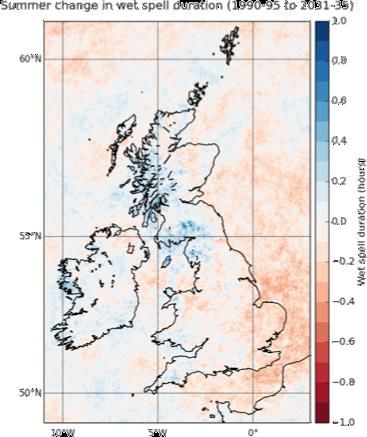
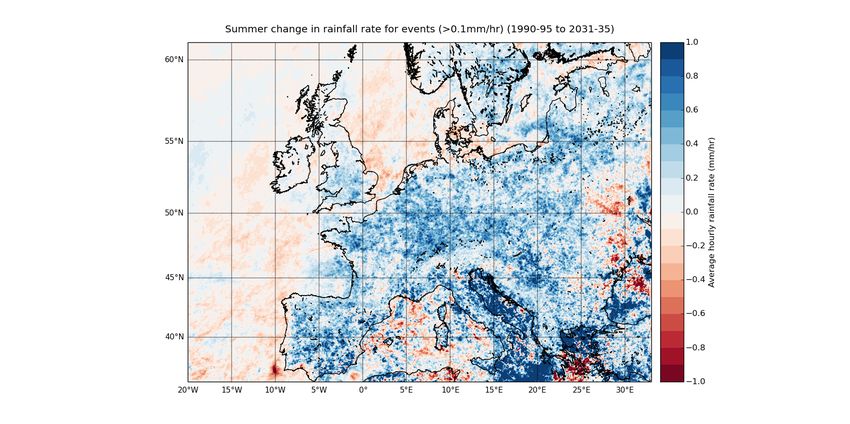
Summer, JJA,
(for domain D02 ~
Europe) changes
in total rainfall
(upper panel)

and

  change in rainfall
rate for each event
(lower panel).

   All changes are
produced by
subtracting the
1991-1995 from the
2031-2035 average
values at each
pixel.

                       Jasmin - network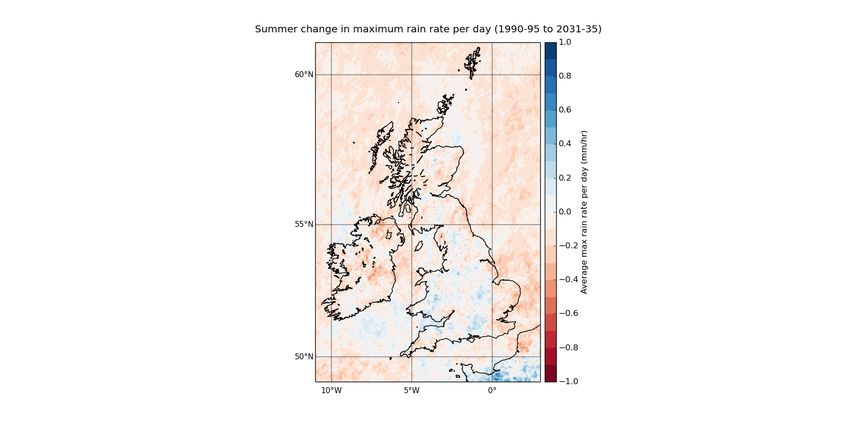
Summer, JJA, (for domain D02 ~ Europe).
Change in total rainfall (upper left).
Change in mean rainfall rate for each event
(upper right panel).
Change in heavy (> 7.6mm/hr) rainfall (lower
left panel).
Changes derived by subtracting the 1991-
1995 from the 2031-2035 average values at
each pixel.
As with the UK, the shorter convective events
have higher precipitation rate, although no
evidence for an increase in the peak value.
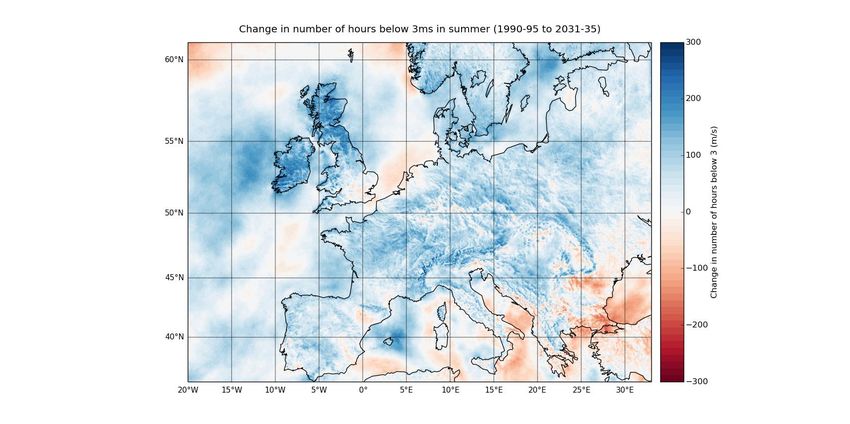
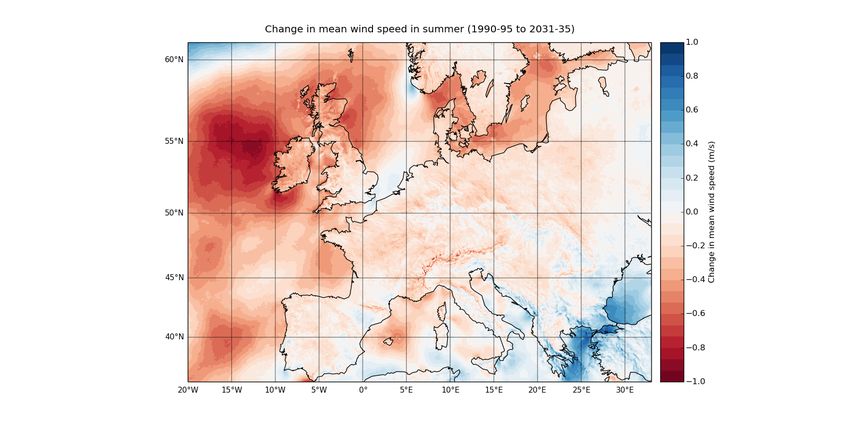
Summer, JJA, (for domain D02)
changes in 10m wind speed and the
change in the number of hours where
the wind speed is less than 3ms-1 at
10m.

All changes are produced by
subtracting the 1991-1995 from the
2031-2035 average values at each
pixel.

The changes in precipitation are
accompanied by an increase in the
prevalence of calmer and more stable
conditions. This supports the
argument that these events arise from
short lived convection, rather than
precipitation cells embedded in
synoptic events.

Calm anti-cyclonic weather, especially
with stable boundary layers can
indicate a likelihood of poorer air
quality and is often associated with
high pressure conditions.
CONCLUSIONS
•A large data set has been constructed, completed in summer 2016, using a convection
permitting (~2.5km) model over Western Europe and embedded in a global channel model
at resolution of less than 20km, for years 1989 – 1995, 2030 – 2036 and 2020 - 2025. This
data set will be available for open access.
•Comparison, of model rainfall simulation results, for ERA-Interim and CESM boundary
conditions and observational climatology for the UK domain is relatively good for the years
1990 – 1995.
•Results of precipitation changes are shown over the UK and for the whole of the European
area. The changes differ in different parts of the European continent.
•Evidence is provided that in the summer months (2031 – 2035) there is more average
rainfall per event, but little change in each maximum rainfall rate. There are longer dryer
spells, shorter wet spells and a generally dryer climatology. These results also appear to a
lesser extent in the (2021-2025) data. Over much of Europe (not Northern Germany) there is
an increase in the number of hours (~ 8hours ) over the summer season.
•Evidence, not shown, of more rainfall in the spring months (2031 – 2035).
•10m mean wind speeds appear to be reduced, and there is an increase of 2 hours per day
in the number of hours when the wind in less than 3ms-1 over much of Europe.
•The proposal is to use the extended data to input to the EFAS model, to compare with
known floods in 1990-1995 and suggest possible changes in future decades.
You can also read