Proposed Wynyard Crossing Bridge Visualisation Simulation Methodology - Buildmedia Limited - Auckland Council
←
→
Page content transcription
If your browser does not render page correctly, please read the page content below
Proposed Wynyard Crossing Bridge - Visualisation Simulation Methodology
June 2019      © Copyright Buildmedia Limited

               Proposed Wynyard Crossing Bridge
            Visualisation Simulation Methodology

                        - Buildmedia Limited
Proposed Wynyard Crossing Bridge - Visualisation Simulation Methodology
June 2019 © Copyright Buildmedia Limited
Contents
1.0 Introduction
2.0 Process Methodology – Visual Simulations
3.0 ConclusionProposed Wynyard Crossing Bridge - Visualisation Simulation Methodology
June 2019 © Copyright Buildmedia Limited
1.0 Introduction captured every 10 degrees using a specialist panoramic head to
remove parallax error.
Buildmedia was engaged to prepare imagery visualizing the
proposed bridge at Wynyard Quarter. Camera positions for the viewpoints were captured by Precision
Aerial Surveys on the 18th of May 2019. The coordinate system
The viewpoints were selected by Stephen Brown of Brown New used was NZTM. Vertical datum was corrected to chart datum to
Zealand Limited. match the 3d model and tide heights.
Buildmedia are recognized specialists in this discipline and utilise 2.2 Development of the 3d model of the Development
the best surveying and computer visualisation practices available. The 3D model of the proposed bridge was supplied to Buildmedia
The proprietary techniques and processes Buildmedia has as a Revit file by Monk Mackenzie.
developed, create robust and dependably accurate imagery.
The Revit file was imported into 3DS Max in the correct coordinate
Buildmedia's work does not include the assessment or
system.
interpretation of the visual simulations for issues relating to the
development visibility and its visual effects.
The 3d model was compared to both hard and soft copies of plans
The following methodology description explains the steps and elevations to ensure consistent accuracy.
Buildmedia employed in the creation of the visual simulations.
2.3 Creating the Panoramic Photo
All photographs captured on site by Buildmedia were post-
2.0 Process Methodology Retirement Resort Visual Simulations processed to remove any elements of lens distortion and stitched
The Visual Simulations created by Buildmedia were prepared using together using specialized photogrammetric panoramic software.
best surveying and visualisation practices and involve a series of
processes and steps to ensure consistency and accuracy in the Each photograph was then tied into its adjacent photograph using
development of each image. The following steps briefly identify the relative tie points to create an accurate panorama. A minimum of
method in which the retirement resort was visualised 30 control points were used to ensure a high level of accuracy.
2.1 On Ground Photography Panorama photographs are generated with 90 degree field of view
A series of photographs for viewpoints 01 and 02 were captured on using true rectilinear projection to accurately simulate a camera
the 21st May 2019 and viewpoints 03 to 06 were captured on 18th lens with an equal field of view of 90 degrees.
May 2019 using a professional Sony ILCE-7RM2 digital camera with
a 35 mm lens (1.0 multiplier) using a tri-pod. Photographs wereProposed Wynyard Crossing Bridge - Visualisation Simulation Methodology
June 2019 © Copyright Buildmedia Limited
2.4 Virtual Camera Placement
Virtual cameras are placed into the 3D scene matched to the GPS 2.8 Final Image Enhancements
coordinates of the field camera position ascertained on site by 2D image editing software was used to correctly edit what would
Precision Aerial Surveys. normally appear in the foreground of the image. Foreground
features were transcribed out of the original photograph and
The field of view and aspect ratio of the virtual camera was then placed into their exact position in front of the 3D object.
adjusted to match the rectilinear image field of view of 90 degrees.
Buildmedia carefully compared onsite photography, landscape
2.5 Generation of Tie Points for each Panorama plans and aerial photography when photo-editing the photography.
Tie points are specific, identifiable surveyed objects visible in both
the 3D model and the panorama photograph. They are used to Final post effects were added to match the photography and mimic
match the virtual camera target to the rectilinear image. other environmental factors such as distance haze were applied as
post effects to improve the quality of the final result.
Tie point were captured by Precision Aerial Surveys. The 3D tie
point position indicators were added into the 3D scene at the 2.9 Presentation sheet layouts
actual positions determined by Precision Aerial Surveys. The virtual
The final images were assembled using Adobe InDesign into PDF
camera was then altered in direction so that the tie points matched
sheets that included titles, tie-point information, and necessary
the rectilinear image. Multiple tie points were used across the
camera information.
width of the view to ensure consistent accuracy. They were then
rendered and overlaid onto the existing panorama.
3.0 Conclusion
2.6 Tide Heights Buildmedia use the best surveying and visualisation practices and
Calculating times and tide heights between high and low waters involve a series of processes and steps to ensure consistency and
was calculated using the method set out on the LINZ website. All accuracy in the development of each visual simulation. These visual
heights are then corrected to match the vertical datum of the simulations accurately represent the proportions and location of
survey and 3d model. the proposed development and views from the selected locations
as prescribed by the design information available.
2.7 Rendering
In the 3D model, the sun and environment was simulated at the
precise day and time each original photograph was captured. This
ensures the lighting of the development as well as the shadows
cast, are accurate representations of how the project would appear
post construction in the field photography.Proposed Wynyard Crossing Bridge
Visual Simulations
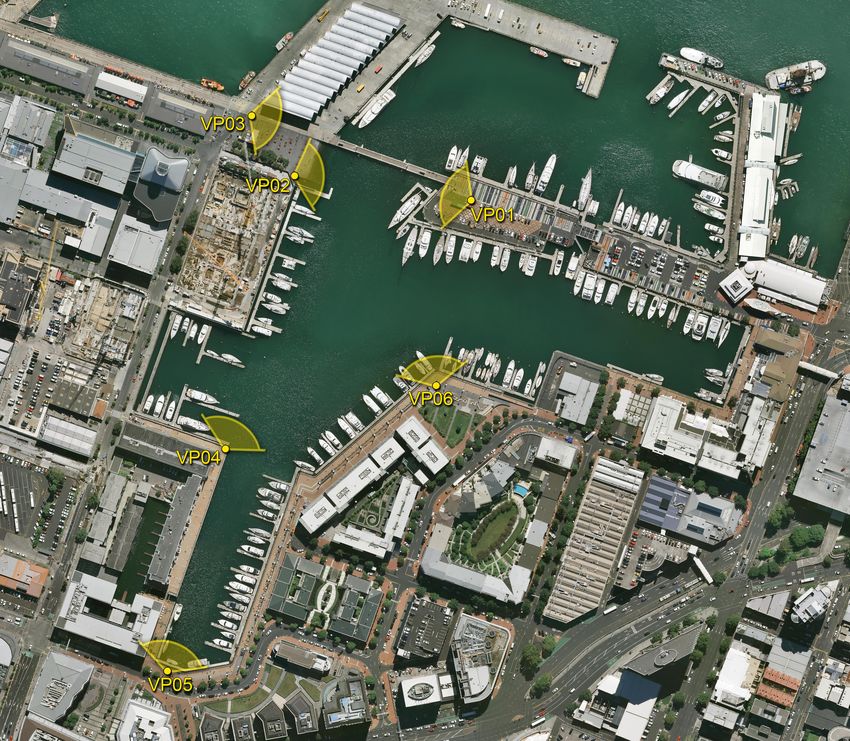
Prepared: 31st May 2019Proposed Wynyard Crossing Bridge - Visual Simulations Prepared: 31st May 2019 CAMERA LOCATIONS MAP
VP01 1756997.088 5921251.585 2.399
VP02 1756849.824 5921274.623 2.939
VP03 1756819.136 5921323.883 2.950
VP04 1756791.929 5921047.004 2.158
VP05 1756747.649 5920862.541 2.889
VP06 1756966.386 5921101.088 2.494
Visual Simulation Locations - Wynyard BridgeYou can also read