Examining Transmission and Distribution
    Infrastructure Across the West
←
→
Page content transcription
If your browser does not render page correctly, please read the page content below

Examining Transmission and Distribution
Infrastructure Across the West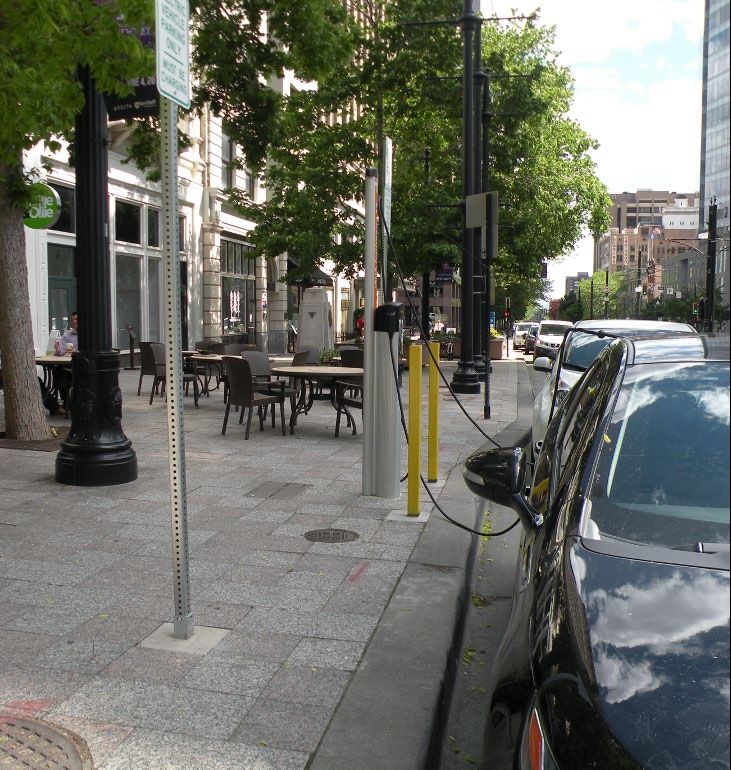
Grid Capacity for
EVs at Scale:
Phase I+II
     Michael Kintner-Meyer

              Sarah Davis
         Dhruv Bhatnagar
               Sid Sridhar
            Malini Ghosal
        Shant Mahserejian

                   WGA Webinar
                February 10, 2021
Purpose of the WECC Study, Phase I
       As adoption of EVs is accelerating, provide insights into the limitations of the US bulk power grid to
       serve the new EV load
       Question 1: Are there sufficient resources in the US bulk power grid to provide electricity to the
                   projected EV fleet?
       Question 2: How will the generation mix dispatch be impacted by the additional EV load?
                   - what are the expected production cost impacts?
                   - what are the challenges and benefits to grid operations

                                     2028 EV adoption : 9 mill. (LDV)                                               Load Profile
WECC                                                    70 K (MDV)                                                    Seattle
                                                        94       fast chargers
                                                                                      SCL                                                       LDV        MDV     HDV
                                                                                                          No of vehicles (LDV, MDV) and
                                                                                                                                            259,532        1,569
                                                                                                          charging events (HDV)
                                                                                                          % of WECC vehicles                          3%     2%

                                                                                                                                                 SCL
                                                                                            600,000

                                                                                            500,000

                                                                                            400,000

                                                                                            300,000

                                                                                       kW
                                                                                            200,000

                                                                                            100,000

                                                                                                 0
                                                                                                      1     2   3   4   5    6   7   8    9 10 11 12 13 14 15 16 17 18 19 20 21 22 23 24
                                                                                                                                          LDV     MDV       HDV

                                                                                                                                                                                     3
Conclusions of Study, Phase I

Question 1: Are the sufficient resources in WECC to provide electricity to the
projected EV fleet?

Answer: YES. high scenario with national fleets of ~24M LDV, 200k MDV, 150k
        HDV are not expected to cause resource adequacy issues in the WECC

         EV carrying capabilities of the WECC: For 2028, we estimated that
         at:
         - for unmanaged charging (HHND): 30-37 M LDVs (plus 200k MDV,
             150k HDV)
         - for managed charging: 65+ M LDV (plus 200k MDV, 150K HDV)

         we are likely to encounter limiting resources to further accommodate
         more EVs, unless more generation and transmission is built              4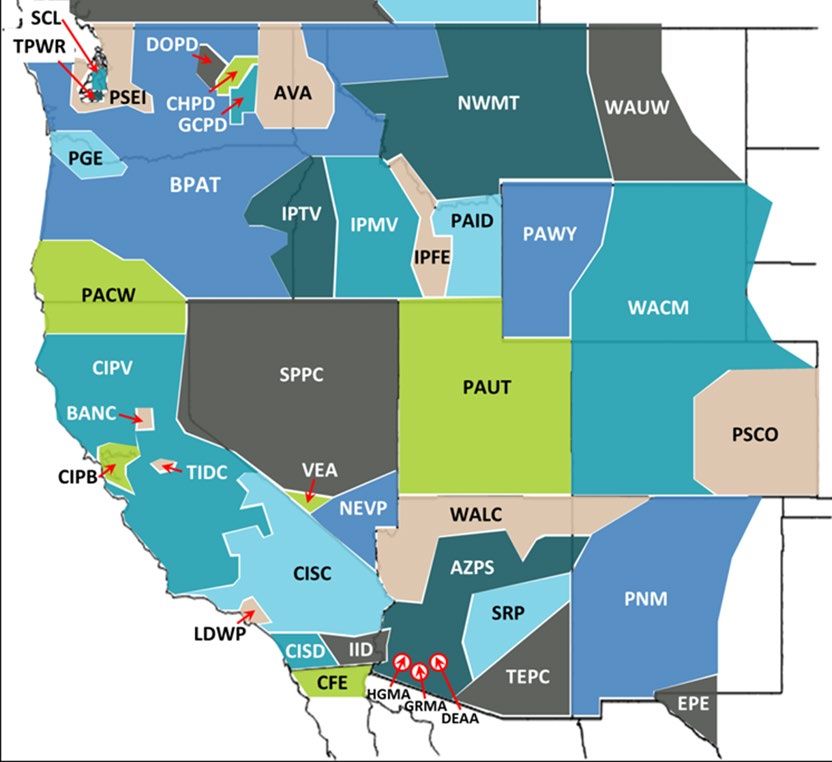
Conclusions of Study, Phase I
Question 2: How will WECC’s generation mix be impacted by additional EV
load?

Answer:
   1. Production cost: at high EV penetration (24M) increases on average 13%, in
      CA highest: 22%, Arizona lowest: 3%
   2. Generators contributing to EV charging:
      1.   primarily natural gas units (CC, CT) with CC carrying the bulk, CT are used during peak
           periods.
   3. Unmanaged “evening charging” stresses the system
      1.   by setting new system peaks
      2.   exacerbates Duck Curve:
   4. EV loads reduces Renewables curtailments 70% or more (WECC)
   5. Managed charging increases the EV hosting capability, avoids curtailment
      and reduced Duck Curve
                                                                                                     5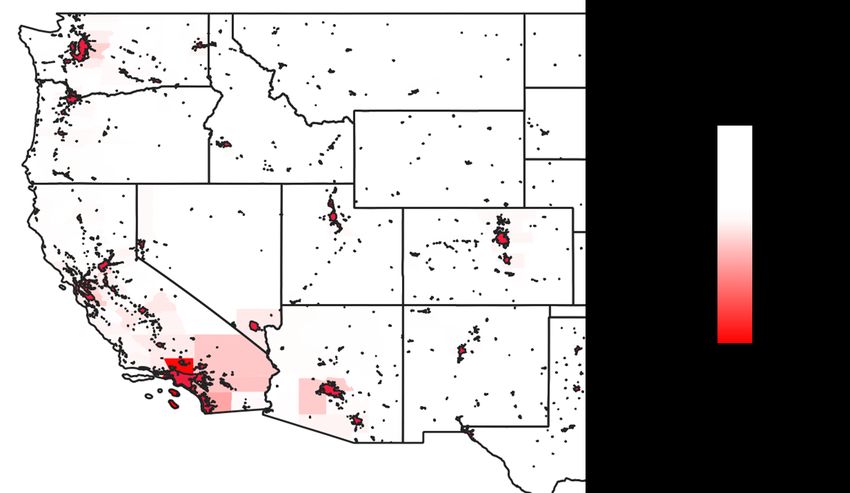
Scope for EV@Scale: DISTRIBUTION, Phase II
• Questions Addressed:
when and where, which EVs(LDV, MDV, HDV), and how Evs impact Distribution ?
Understanding on what the EV hosting capabilities are under various assumptions
given
Utilities’ infrastructure upgrade assumptions for reasons other than electrification of transportation?
Value of managed charging strategies
Other non-wires solutions (DER)
Incorporate EV hosting capability methods into Distribution System Planning
• Outcomes and products
Routines/procedures for utilities to perform Distribution System Planning with EV
considerations
EV (LDV) adoption model by neighborhoods relevant for distribution planning, incentive
analysis, equity studies
Some insights from case-studies with SCE, + ???
6
Example of how to determine EV hosting capability:
               Phase II

    Problem

Thermal limits violation

    Solution 1                                upgrade

                                  Charging technology types   Vehicle types

Charge management
                                               Solution 2                     7
Some policy questions for considerations
• Bulkpower:
Do IRP study look far enough out into the future? Or are they too myopic to exclude EV
penetration targets?
What are the right wholesale market rules to create incentives for Smart Charge
Management?
• Distribution System
What are the retail price signals for inducing smart charge management. Would TOU
schedules be sufficient?
what are the minimum technology requirements on Evs and charging stations to assure
future-proofing technologies?
What is the value of Smart Charging?
• Market adoption of EVs
What are the right incentives for EV adoption and Charging Infrastructure development
from a state as well as utility perspectives?
8
EV Infrastructure Planning
Western Governors’ Association
February 11, 2021

Annie Schneider, Senior Program Specialist, Transportation

2/11/2021                  © 2020 Utah Governor’s Office of Energy Development. All Rights Reserved.
EV Market                                                                   70,000

                                                                            60,000

                                                                            50,000

                                                                            40,000

                                                                            30,000

                                                                            20,000

                                                                                                                                    7,936
                                                                            10,000
                                                                                         1,088
                                                                                 -
                                                                                        2015                                         2020   2025

                                                                                DCFC — 142 outlets
                                                                                L2 — 1,177 outlets

Image source: afdc.energy.gov, vehicle data from the Utah Tax Commission

2/11/2021                                               © 2020 Utah Governor’s Office of Energy Development. All Rights Reserved.
Funding Sources
• State-funded programs
• Workplaces and State
facilities
• VW settlement funds
• DCFC
• Utility programs
• Grants and incentives
Image source: afdc.energy.gov
2/11/2021 © 2020 Utah Governor’s Office of Energy Development. All Rights Reserved.Partnerships Image sources: Utah EV Master plan, 2019 8 state MOU 2/11/2021 © 2020 Utah Governor’s Office of Energy Development. All Rights Reserved.
Utah’s Approach

                                                                         • Be proactive
                                                                         • Encourage more
                                                                           charging infrastructure
                                                                         • Build partnerships

Image source: Utah Clean Cities

2/11/2021                         © 2020 Utah Governor’s Office of Energy Development. All Rights Reserved.
Thank you! Questions? Learn more at energy.utah.gov 801-538-8734 | aschneider@utah.gov 2/11/2021 © 2020 Utah Governor’s Office of Energy Development. All Rights Reserved.
Energy Grid and
                                         EV Charging Infrastructure

             Energy Grid

             Charging
             Infrastructure

                                                                Service Connection   Supply Infrastructure   Charging Equipment

Source: PG&E, Take Charge: A Guidebook to Fleet Electrification and Infrastructure
Key Messages Clean energy: electric transportation (ET) is key to reducing emissions from transportation Electric company roles: deploying infrastructure, expanding access, grid integration Collaboration needed: energy grid is dynamic and evolving; stakeholders key to planning for ET at scale
You can also read