Q1 2019 Collaboration is our strategy - Hembla
←
→
Page content transcription
If your browser does not render page correctly, please read the page content below

Q1 2019 Collaboration is our strategy

Highlights and
                                                                  key figures

HIGHLIGHTS, JAN – MAR 2019                                                       KEY FIGURES
→ Continued high pace of refurbishments                                                                                  Jan-Mar        Jan-Mar
  • 321 apartments refurbished in Q1 2019                                         SEKm                                      2019           2018       2018

  • Improvement of refurbishment labor costs following renegotiation of           Rental income                               477            386     1,786
      contracts                                                                   Net operating income (NOI)                  218            166       931
→ NOI increased to SEK 218 million                                                Change in investment prop.                  659            222     3,737
  • Increase of 31.1% compared to same period last year                           EPRA NAV per share (SEK)                    175            125       167
  • Mainly driven by a larger property portfolio and apartment renovations
→ Comparable portfolio as of Q1 2019
  • NOI margin of 45.2%                                                          RENTAL INCOME AND NOI MARGIN (SEKm)
  • NOI increased by 5.9% compared to same period last year                      2 000                                                                             60%
                                                                                 1 800
→ Unrealized value of investment properties up by SEK 659 million                                                                                                  50%
                                                                                 1 600
  • During the quarter, unrealized value of investment properties increased by
                                                                                 1 400
      SEK 659 million compared to SEK 222 during the same period last year                                                                                         40%
                                                                                 1 200
   • Supported by strong market fundamentals and NOI growth
                                                                                 1 000                                                                             30%
                                                                                   800
                                                                                                                                                                   20%
                                                                                   600
                                                                                   400
                                                                                                                                                                   10%
                                                                                   200
                                                                                     0                                                                             0%
                                                                                           Jan-Dec 2015        Jan-Dec 2016         Jan-Dec 2017    Jan-Dec 2018

                                                                                                                  Rental income        NOI margin
                                                                                                                                                                         2
Organizational change with focus on
                                                         tenants

ORGANIZATIONAL CHANGE CURRENTLY TAKING PLACE IN
THE COMPANY
→ For us, improving the tenant satisfaction is the most important factor that will
    ultimately tell us that we have succeeded
→ The regional structure of the property management business area is being
    converted into an organizational setup divided by function
→ The new organization is expected to deliver a higher level of service, enabling
    us to:
       → Better harness the skills of our employees
       → Create new, professional development opportunities for our employees
→ Every employee in the property management organization has actively
    participated in the creation of new processes and working methods
→ An organizational change of this scale is a big investment which requires:
       → Time
       → Personnel
       → Monetary resources
→ Non-recurring costs for the organizational change are estimated to be
    approximately SEK 25 million and are expected to yield in excess of SEK 10
    million in annual savings going forward

                                                                                     3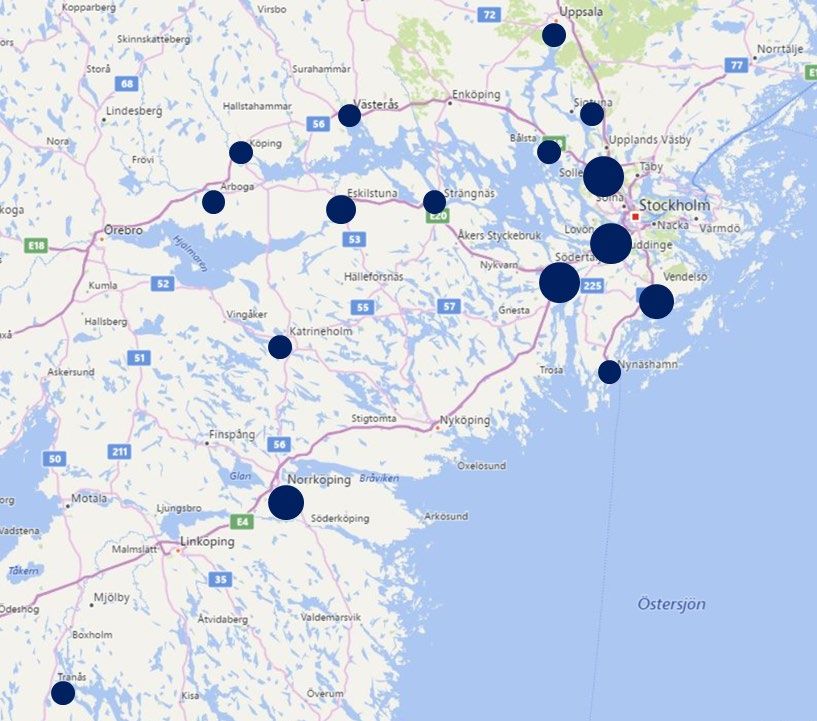
Overview
                               property portfolio

STRONG FOOTHOLD IN STOCKHOLM

                                                21,410                  1,690k
                                               APARTMENTS           LETTABLE SQM

                                                                          11%
                                                                     3%
                                                    SEK             4%
                                                                   9%
                                                32.1bn
                                               MARKET VALUE        10%                 63%

                                                              Stockholm   Norrköping   Eskilstuna
                                                              Uppsala     Västerås     Other

                                                                                                    4
The number of people in the Stockholm rental
                                          housing queue is still increasing

STOCKHOLM HOUSING QUEUE STATISTICS                                                            COMMENTS
                                                                                              → We remain focused on improving and increasing our portfolio to help
                                                                                                   address the demand for rental housing

                                                                                                                                           9,0%
                     600 000
                                                                                                                                           7,5%
                     500 000
                                                                                                                                           6,0%
                     400 000
                                                                                                                                           4,5%
                     300 000

                     200 000                                                                                                               3,0%

                     100 000                                                                                                               1,5%

                               0                                                                                                           0,0%
                                      2000 2001 2002 2003 2004 2005 2006 2007 2008 2009 2010 2011 2012 2013 2014 2015 2016 2017 2018

                                                    Number of people in rental queue     Let apartments per year as share of total queue

          Source: Bostadsförmedlingen i Stockholm                                                                                                                     5
Rental income and net operating income increased
by 24% and 31% respectively in Q1 2019
KEY INCOME FIGURES DEVELOPMENT (SEKm) COMMENTS
→ Rental income increased by 23.5% in Q1 2019 compared to same period
600 100% previous year
→ Net operating income increased by 31.1% in Q1 2019 compared to the same
period last year
500
80% → Q1 2019 NOI margin amounting to 45.6%, compared to 43.0% in the same
period previous year
400
60%
300
40%
200 Q1 2019 Q1 2019 Q1 2019
RENTAL INCREASE NOI INCREASE NOI MARGIN
100
20% 23.5% 31.1% 45.6%
0 0%
Q2 16 Q3 16 Q4 16 Q1 17 Q2 17 Q3 17 Q4 17 Q1 18 Q2 18 Q3 18 Q4 18 Q1 19
Rental income Net operating income
NOI - Margin Surplus ratio - target
6Continued strong growth in
EPRA NAV per share
EPRA NAV DEVELOPMENT, Q1 2019 VS Q1 PREVIOUS YEARS EPRA NAV DEVELOPMENT QUARTER ON QUARTER
200 40% 200 60%
180 35% 180
50%
160 160
30%
140 140
40%
120 25%
120
100 20% 100 30%
80 15% 80
60 20%
60
10%
40 40
10%
20 5%
20
0 0% 0 0%
Q1-16 Q1-17 Q1-18 Q1-19 Q1 Q2 Q3 Q4 Q1 Q2 Q3 Q4 Q1 Q2 Q3 Q4 Q1 Q2 Q3 Q4 Q1
15 15 15 15 16 16 16 16 17 17 17 17 18 18 18 18 19
Equity (EPRA NAV) per share Equity ratio
Equity (EPRA NAV) per share Equity ratio Equity ratio - target
COMMENTS
→ Increase in EPRA NAV to 175.3 SEK per share as of Q1 2019, up 40% YoY
→ Compared to the most recent quarter (Q4 2018), EPRA NAV increased by 4.9%, driven by NOI growth and strong market fundamentals
→ The slight drop in Q1 2018 is a result of the dilutive effect of the rights issue
→ EPRA NAV per share development shows consistently strong growth over time
7Investing in a
strengthened organization
CENTRAL ADMINISTRATION COST DEVELOPMENT, LTM COMMENTS
→ Central administration has increased to SEK 194 million for the period April
250 120 2018 – March 2019 compared to SEK 128 million for the same period in the
previous year
→ The increase is partly driven by non-recurring costs amounting to SEK 27
100 million for the year relating to costs for digitalization (SEK 6 million) and
200
rebranding (SEK 21 million)
→ A strengthened organization resulting in increased personnel costs, further
80
improved IT- system and consultancy costs are other drivers of the increased
150 central administration during the period. We expect this to increase the
performance on asset-level when fully implemented.
60
100
40
50
20
0 0
Q1 17 Q2 17 Q3 17 Q4 17 Q1 18 Q2 18 Q3 18 Q4 18 Q1 19
CA (LTM) CA per sqm (LTM)
8Continuously
optimizing capital structure
OVERVIEW LOAN VOLUME & AVERAGE INTEREST RATE (SEKbn)
→ Hembla is continuously focused on optimizing its capital structure
→ 93% of the debt is non-recourse, improving financial
resilience
→ Maturity on senior secured debt of 5.6 years
~93% Non-Recourse
→ Average interest rate on senior secured debt 2.0% (2.1% on strengthening
financial resiliance
total debt)
→ Financings and capex drawdowns amounted to
SEK 855 million in Q1
→ Total LTV1 at 56.0%.
→ Focus on financings in line with Hembla’s
overall financing strategy PROPERTY VALUE AND LOAN-TO-VALUE (SEKbn)
→ Long-term loans combined with
capex top-up facilities
→ Non-recourse
1: Including building rights & bond
9Enhanced living environments for tenants
through refurbishment
NUMBER OF REFURBISHED APARTMENTS, LTM1 COMMENTS
1800 → Hembla renovated 321 apartments during Q1 2019
1600
1400 → The total number of renovated apartments in the portfolio amount to 5 966
1200 units
1000
800 → The number of non-refurbished apartments in the portfolio amounts to 15,444,
600 corresponding to 72% of the total stock
400
200 → Apart from apartment refurbishments, Hembla has also invested ~ SEK 200
0 million during Q1 2019 in the properties’ exterior and surroundings such as
Q1 Q2 Q3 Q4 Q1 Q2 Q3 Q4 Q1 Q2 Q3 Q4 Q1 Q2 Q3 Q4 Q1 façades, common areas, outdoor environments, geothermal heating etc.
15 15 15 15 16 16 16 16 17 17 17 17 18 18 18 18 19
Refurbished apts (LTM) → Significant development potential and asset-level upside remains
→ Refurbishments driving continued growth in rental income
Q1 2018 Q2 2018 Q3 2018 Q4 2018 Q1 2019
Refurbished
apts as % of
9.2% 8.8% 8.5% 7.9% 7.3%
average apt
stock:
% of unrefurb. 11.7% 10.8% 9.9% 9.9% 10.4%
Stock:
1 Figures include all apartments refurbished by Hembla, i.e. numbers exclude acquired renovated apartments and include divested renovated apartments
10Closing
CLOSING REMARKS
→ Listening to and acting on the views of our tenants
→ Being a long-term residential owner
→ Creating value by renovating and enhancing living environments for our
tenants
→ Continuing to focus on improving and growing our portfolio
→ Providing good service to make our tenants’ life easier
11Thank you! SVEIN ERIK LILLELAND CEO SEL@HEMBLA.SE JONAS ANDERSSON CFO JONAS.ANDERSSON@HEMBLA.SE hembla.se
You can also read