Electric vehicle study - CITY OF MINNEAPOLIS

Page created by Charlie Gibson
 
CONTINUE READING
Electric vehicle study - CITY OF MINNEAPOLIS
Electric vehicle study
CITY OF MINNEAPOLIS

                         1
Electric vehicle study - CITY OF MINNEAPOLIS
Electric vehicles in the city fleet

  Overview of presentation
    • Staff direction
    • City fleet and current market
    • Financial analysis
    • Next steps

                                      2
Electric vehicle study - CITY OF MINNEAPOLIS
Electric vehicles in the city fleet
   • Staff direction
     • Benefits
     • Feasibility
     • Reasonable exceptions
     • Cost benefit
     • Various alternatives
     • Recommended approach
                                      3
Electric vehicle study - CITY OF MINNEAPOLIS
Electric vehicles in the city fleet

                                      4
Electric vehicle study - CITY OF MINNEAPOLIS
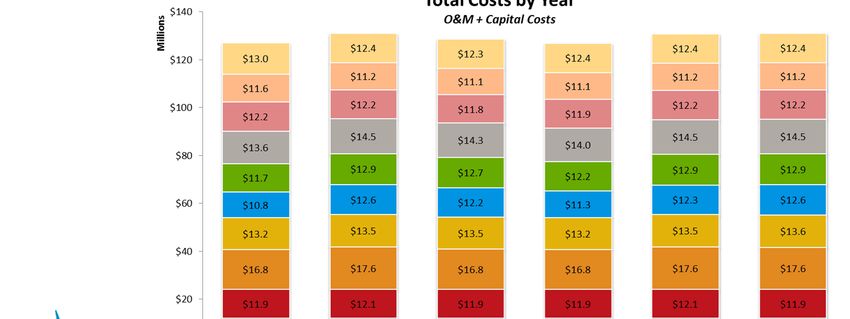
Why Electric Vehicles (EV) ?

                •City of Minneapolis Climate Action Plan (2006)
Electric vehicle study - CITY OF MINNEAPOLIS
Why Electric Vehicles (EV)?
                              Greenhouse Gas Emissions Trend – MPLS Fleet
                     20,000
                                                                     Metric Tons CO2
                     18,000
                     16,000
                     14,000
   Metric Tons CO2

                     12,000
                     10,000
                      8,000
                      6,000
                      4,000
                      2,000
                         0
                                   2013         2014          2015             2016
                                                       Year
                                                                                       6
Electric vehicle study - CITY OF MINNEAPOLIS
Current electric vehicle availability

          Light                     Heavy                        Non‐Road
       Duty Vehicles             Duty Vehicles                    Vehicles

              SUV /                 Trucks
                       Light Heavy          Solid         Heavy           Light               All
     Sedans    Mini                 / Cargo
                      Pickup Pickup         Waste         Const.         Const.              other
               vans                  Vans

                                                            Barclays Center, Brooklyn, New York

EV    Yes      Yes    Testing   R&D   Testing   Testing    R&D              R&D              Testing
Electric vehicle study - CITY OF MINNEAPOLIS
City vehicle profile
              Light Duty                                                Heavy Duty                                   Non‐Road
               Vehicles                                                  Vehicles                                     Vehicles

                                                                                                                                            All other Vehicles
                    SUV / Minivans

                                                                           Trucks / Cargo
                                                        Heavy Pickups
                                       Light Pickups

                                                                                                            Construction

                                                                                                                           Construction
                                                                                              Solid Waste
         Sedans

                                                                                                               Heavy

                                                                                                                              Light
                                                                               Vans
Total   297        160                 16              240                  191               55              29             18               3

                                                                                                             Volvo
                                                                          Western            Crane
         Ford      Ford               Chevy            Ford                                                 Wheel          Bobcat         Polaris
Ex.     Focus     Escape             Colorado          F-250
                                                                           Star             Carrier
                                                                                                            Loader          S185          Ranger
                                                                          SB4700            LET2-40
                                                                                                              L-90
Electric vehicle study - CITY OF MINNEAPOLIS
Electric vehicles in the city fleet

     •Scenario Evaluation
       • Background
       • Approach
       • Outcomes

                                      9
Strategies for EV Transition
   Terminologies
    Benefits
    • Maintenance Savings: The savings in parts and labor for maintaining the
      vehicle fleet and electric charging infrastructure
    • Fuel Savings: The savings in fueling the entire fleet, includes gasoline,
      biodiesel, and electricity purchases from business‐as‐usual (BAU)
    • CO2 Reduction: The metric tons of carbon dioxide (MTCO2) emissions reduced
      from BAU

    Costs
     •   Total Capital Costs: The cost of purchasing the vehicles and charging stations
     •   Total O&M Costs: The total 10‐year lifecycle costs for fuel and maintenance
         of the fleet
     •   Lifecycle Costs: The summation of Total Capital Costs and Total O&M Costs
Strategies for EV Transition
   Terminologies
    Net Present Value
     • Net Present Value: The total discounted net benefits over
       the analysis period and represents the value of the total
       benefits minus costs in 2017 dollars
    • Discount Rate: The analysis employs a discount rate for
       present value discounting. The discount rates capture the
       time‐value of money as well as uncertainty risk.

    Cost Effectiveness
     • Cost Effectiveness ‐ CO2 Reduction: Compared to BAU, the
       cost to save one metric ton of CO2 by integrating electric
       vehicles into the fleet for each scenario
Strategies for EV Transition
   Formation of Scenarios
    Key Assumptions
   • 10 year timeframe for all scenarios (2018 ‐ 2027)
   • Number of EV replacement in a year < Number of ICE replacements in a year
   • All ICE vehicles cannot be converted to EV in a 10 year timeframe

           City’s Existing
                                           Projected EV
          Plan for Vehicle
                                             Industry             Assumed
            Replacement
                                              Pricing,            Financial
          (i.e., how many
                                          Technology, &          Constraints
            vehicles each
                                              Trends
                 year)

                                                           Number
                             Priority Goals of            and Type of
                                   Fleet                   EV to be
                                Conversion                Replaced in
                                                            a Year
Strategies for EV Transition
 Formation of Scenarios ‐ (Including Consideration of
 Financial, Industrial and Technical Constraints)
     Scenario Objectives
    • Scenario 1 ‐ Maximize CO2 reduction without financial constraints
    • Scenario 2 – Maximize CO2 reduction with $5M financial constraint
    • Scenario 3 – Maximize Net Present Value with $5M financial constraint
    • Scenario 4 – Maximize Total Benefits (fuel, maintenance and CO2)
    • Scenario 5 – Maximize total number of EV’s purchased
    • Scenario 6 ‐ Maximize Net Present Value while delaying EV purchase for
                   two years to save funding (results same as Scenario 3)
     Key Considerations Among All Scenarios
     • No SUV / Minivan Vehicle Purchase Until 2020
     • No Heavy Duty Vehicle, Heavy Construction Vehicle, Light Construction
       Vehicle Purchase Until 2022
Strategies for EV Transition
      Results and Comparison of Scenarios

           Business   Scenario Scenario   Scenario   Scenario Scenario
           As Usual      1        2         3/6         4        5
Strategies for EV Transition
                  Results and Comparison of Scenarios
                  Total Number of EVs
            500     45%                                                     45%     50%
                                                                   44%
            450                                                                     45%
            400                                                                     40%

                                                                                          Percent of Fleet
            350                                                                     35%
•# of EVs

            300                 27%                                                 30%
            250                                                                     25%
            200                                                                     20%
                                         8%
            150                                                                     15%
                                                    8%
            100                                                                     10%
            50                                                                      5%
                     456     271          82          82           439      458
             0                                                                      0%
                    Sc. 1    Sc. 2       Sc. 3       Sc. 6         Sc. 4    Sc. 5
                                     Number of EV        Percent of Fleet
Strategies for EV Transition
             Results and Comparison of Scenarios with BAU
             Benefits [ Maintenance Savings, Fuel Savings, CO2 Reduction ]
         3                                                                          10.6   12
                         10.8                                       10.7
                                                                                           10

                                                                                                MTCO2 in Thousands
                                   7.7
         2                                                                                 8
•Million $

                                                 4.7          4.7                          6

         1                                                                                 4

                                                                                           2
                0
         0                                                                                 0
               BAU       Sc. 1     Sc. 2     Sc. 3     Sc. 6        Sc. 4     Sc. 5
                       Maintenance Savings     Fuel Savings         CO2 Reduction
Strategies for EV Transition

         Results and Comparison of Scenarios with BAU
         Costs [ Total Capital, Total O&M (Fuel + Maintenance), Lifecycle ]

              140   127   131.1   128.7   126.9 126.9 130.8       131.1
              120
              100
               80
  Million $

               60                                                         Total Capital Costs

                                                                          Total O&M Costs
               40
                                                                          Lifecycle Costs
               20
                0
                    BAU   Sc. 1   Sc. 2   Sc. 3   Sc. 6   Sc. 4   Sc. 5
Strategies for EV Transition
             Results and Comparison of Scenarios with BAU
             Net Present Value (NPV) [ NPV (3% & 7% Discount), Change in NPV from
             BAU (3% & 7% Discount) ]
             20                                  0.8        1.7         1.7             0
                     0          0.6             1.4        2.5         2.5            0.8     0.6
              0
             ‐20
             ‐40
Million $

             ‐60
             ‐80
            ‐100
            ‐120
                    BAU       Sc. 1           Sc. 2     Sc. 3        Sc. 6       Sc. 4      Sc. 5
                          NPV (3% Discount)             NPV (7% Discount)
                          Change in NPV (3% Discount)   Change in NPV (7% Discount)
Strategies for EV Transition
    Results and Comparison of Scenarios with BAU
    Cost Effectiveness [ CO2 Reduction ]
  400              $ 375                                             $ 378
                                                             $ 357
  350
  300
                              $ 222
  250
  200
  150
  100
   50
          $0                               ‐ $ 23   ‐ $ 23
    0
  ‐50
         BAU        Sc. 1     Sc. 2        Sc. 3    Sc. 6    Sc. 4   Sc. 5
                      CO2 Reduction (Per MTCO2 Reduced)
Costs and Benefits of EV Transition
    Cost Considerations
      Capital Costs
    • EV typically have lower fuel and maintenance costs than ICE vehicles,
      but higher capital costs
    • There is industry consensus that the cost of EVs are trending downward
      as production volumes increase and battery costs decreases

    Fuel Economy Estimates
     • EV typically achieve better fuel economy and have lower fuel costs
       than similar ICE vehicles
     • The cost per kWh of electricity tends to be lower and more stable than
       the cost per gallon of gasoline, diesel, or bio‐diesel
Costs and Benefits of EV Transition
    Cost Considerations
      Maintenance Costs
    • EV has less moving parts, hence lower maintenance cost
    • Over 5 years, EVs can save an average of 35% on maintenance in
      comparison to ICE vehicles

    Charging Infrastructure Considerations
    • Plan ahead and install more Electric Vehicle Supply Equipment (EVSE)
      charging stations than currently needed (cost effective)
    • EVSE should be purchased at approximately 1:1 ratio with number of
      EVs
      (All EV can be charged adequately overnight)
    • Planning for fleet recharging during off‐peak periods can add up to
      thousands of dollars in savings
    • Special tariff from power suppliers for usage during off‐peak hours
Costs and Benefits of EV Transition
     Environmental Benefits
     Estimated Annual Carbon Dioxide Emissions per Vehicle (pounds)
     Over a 10 year period (2018‐2027)
                                            ‐64%
70,000
60,000                                             ‐40%
                                     ‐50%
50,000
40,000
30,000
20,000                                                     ‐40%
              ‐63%    ‐60%   ‐70%
10,000 ‐66%                                                              ‐56%                        ICE
     0                                                                                               EV
                                                              Ivy Station, Culver City, California
Considerations Before EV Adoption

    Monitor:
    • Electric Vehicle Usage in Winter Months
    • Potential Sources of Funding for EV Purchases
    • Industry Progress with EV

    Review:
    • Vehicle Replacement Approach for New EV Models

    Prepare:
    • Infrastructure and Maintenance Staff for EV Operations
CITY OF MINNEAPOLIS

                      Questions

                                  24
You can also read