Step to the active smart building with continuous monitoring - AIIR
←
→
Page content transcription
If your browser does not render page correctly, please read the page content below
Zoltan MAGYAR, PhD
                                                  Chair of HVAC Department
                                                      Budapest University of
                                                  Technology and Economics
                                                          Budapest, Hungary
Budapest University of Technology and Economics
                                                        magyar@egt.bme.hu
                                                         zmagyar@invitel.hu

     Step to the active smart building
       with continuous monitoring

    RCEPB, Bucharest, 5 June, 2014
                                                                        1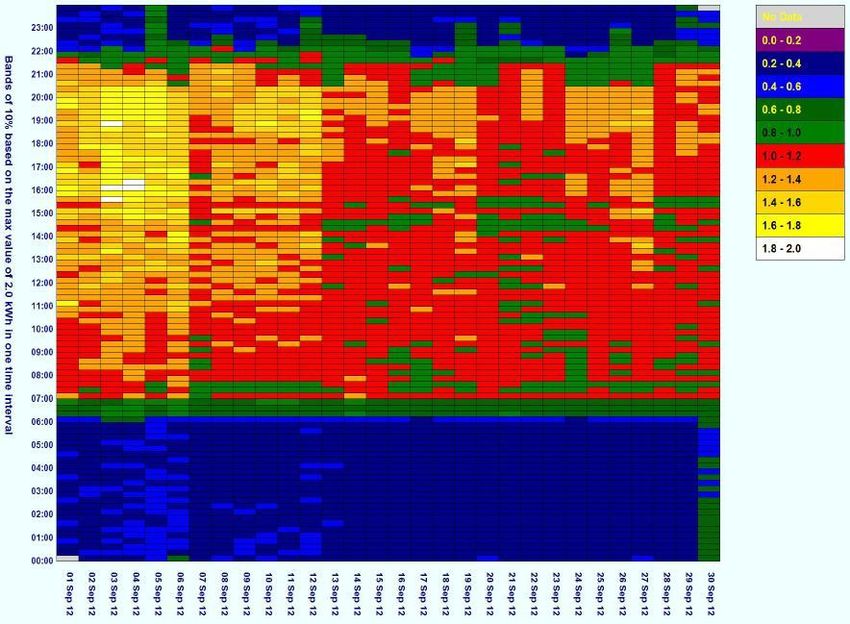
Active smart building
Context: Potential Energy Saving

Potential for savings
through:

  – Load reduction (24%)
  – Improved efficiency (39%)
  – Better operation (37%)

Source: HarmonAC project results. http://www.harmonac.info/

                                                              3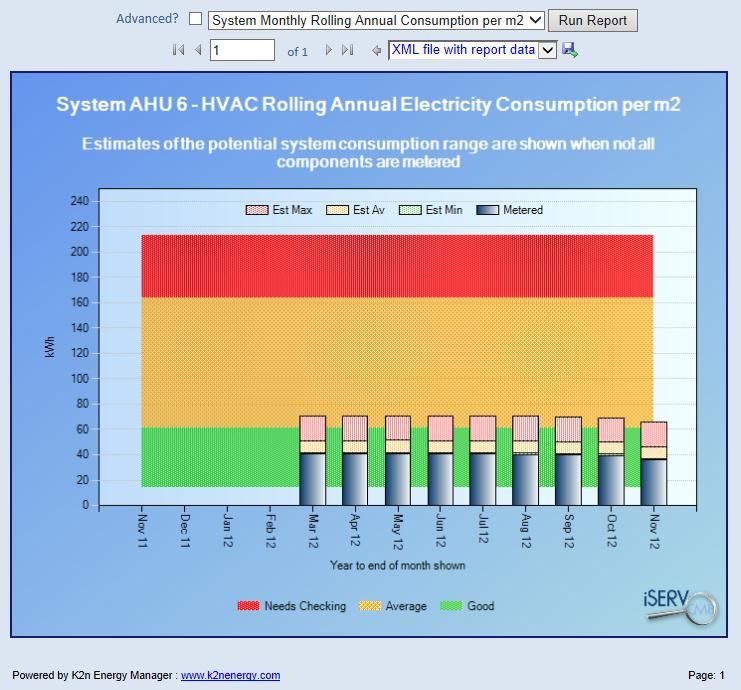
EU Directives
Energy Performance of Building Directive
EPBD 2002/91/EC
Ecodesign of Energy Using Products Directive
2009/125/EC
Energy Labelling Directive 2010/30/EU
EPBD „recast” 2010/31/EU
Energy Efficiency Directive EED 2012/27/EC
4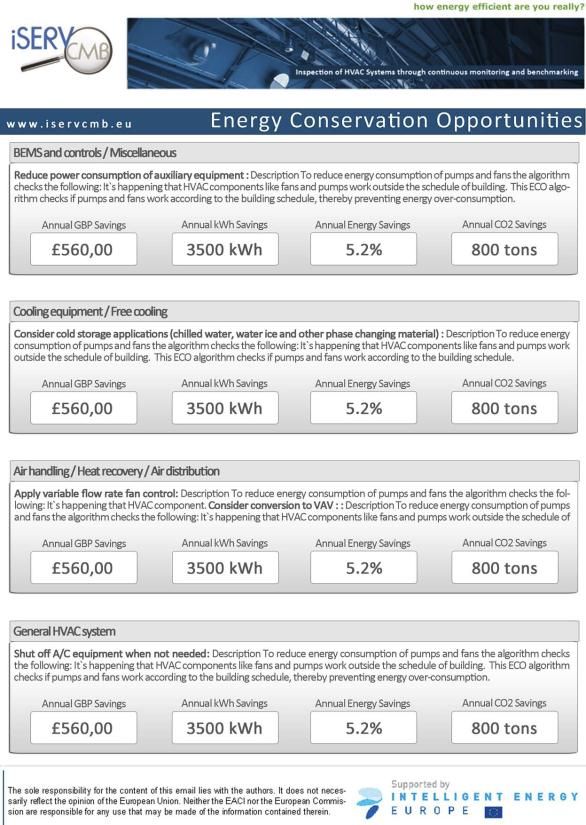
Acknowledgements
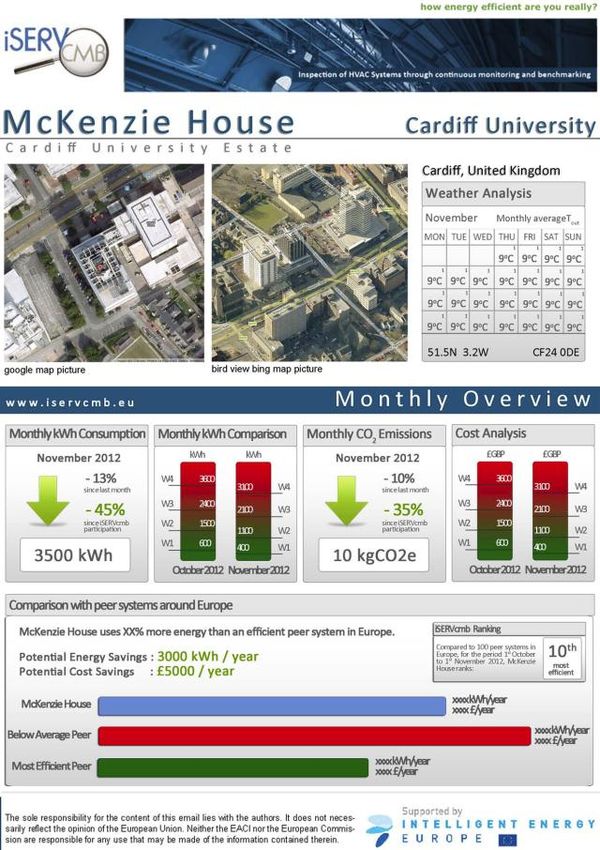
iSERV Inspection of HVAC systems through
continuous monitoring and
benchmarking
www.iservcmb.info
Co-ordinator: Prof. Ian Knight
Cardiff University, UK
2012 - 2014
5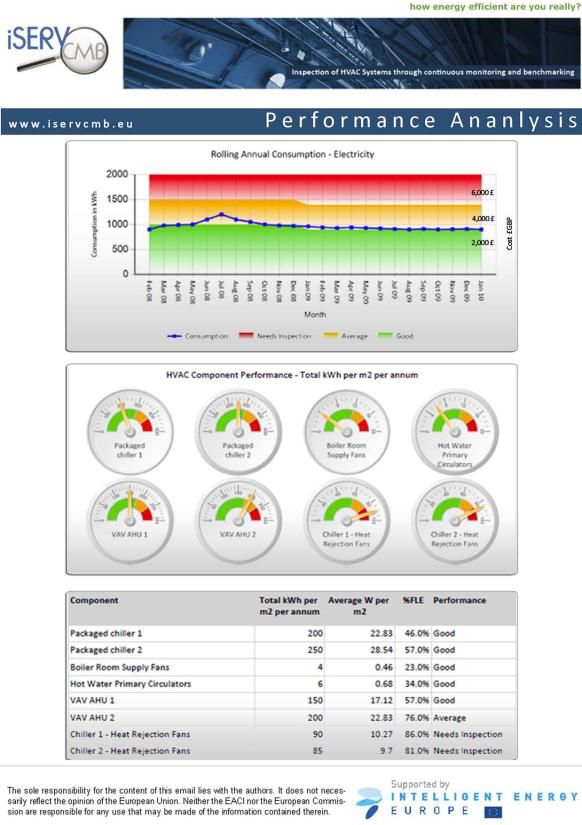
A 20th Century approach to a 21st
            Century problem
•   Most EU MS Legislation aimed at reducing
    energy use looks at whole buildings and
    annual energy use due to the availability of
    billing meters for most buildings.
•   So we know WHAT we are using, but not
    WHY we are using it.
•   Current processes do not show what is
    possible to achieve with our actual existing
    building and activity mixes.
•   Most organisations JUST comply with
    legislation, i.e. they spend time and money
    on compliance exercises but not improving
    their energy use in a robust manner.

                                                   6
A 21st Century approach to a 21st
            Century problem
• New data sources now
  allow us detailed
  insights into how energy
  is used at sub-hourly
  intervals and by end
  uses.
• This level of detail is
  sufficient to provide
  confidence in what
  needs to be done to
  reduce energy use.
• iSERV utilises these new data sources to show how such a new
  approach might work - from defining the buildings through to how it
  might work with legislation.

                                                                        7
The iSERV recipe

                            Sub-hourly
A Spreadsheet           +   data

+    A database
                        +   Component
                            benchmarks

     Targeted
 +   reports            =   Energy
                            savings

                                         8
Overview of basic process

Initial Data
 Entry via                              Reports
Excel sheet
                        iSERV web
                       database and
  Meter/                  analysis       ECOs
sensor data              software

Utility costs/                        Benchmarks
   tariffs -
GBP/EUR/etc

                                                   9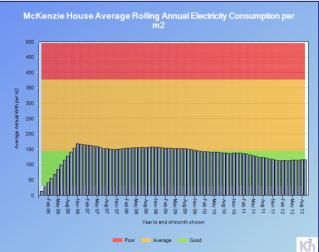
Collate information on the building
•   iSERV has set up a spreadsheet to act as a data collection focus for the
    building, meters and services physical elements
•   The spreadsheet also acts as a means of connecting all the elements
    together

                                                                           10
Database
• A bespoke database has been written for the project
• Based on a commercial product
• Acts as the focus for the iSERV project elements:
– Data collection
– Benchmark use
– Benchmark
generation
– Reports
– Energy
Conservation
Opportunity
algorithmsBenchmarks Three types of benchmark being produced and explored: • Annual energy/m2 – kWh/m2.a • Monthly energy/m2 – kWh/m2.month • Power demands/m2 – W/m2
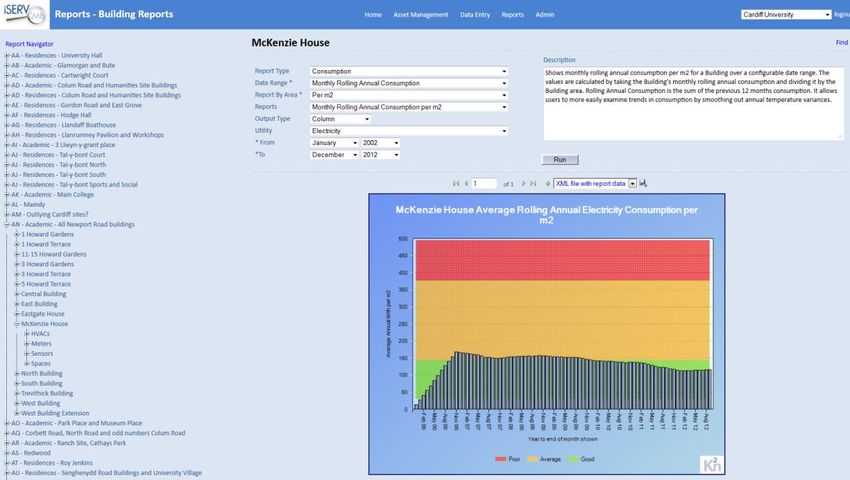
Three ways to save energy –
       regularly show performance
• Regularly show
  performance against
  benchmarks derived from
  the spreadsheet
  description of the building
  and services
• Benchmarks will evolve
  over time as the buildings /
  components providing data
  change their performance –
  so benchmarks always
  reflect current practice
Identification of Energy Conversation Opportunities (ECOs)
Identification of Energy
Conversation Opportunities (ECOs)
Three ways to save energy – better
      control of existing plant
• Better control of what you
  already have e.g. use of
  ECO algorithms or
  scatter graphs/carpet
  plots to identify when
  systems and
  components are running
  outside of expected
  hours
• Clearly shows what could be controlled better
• Can use the data directly to calculate potential savings

                                                             16
Three ways to save energy – install
more efficient equipment
• Install more efficient
equipment. Even if equipment
is well controlled it may well
require more power when in
use than more modern
equipment
• Benchmarks based on power
demands when in use can help
show this difference and when
equipment might benefit from
being upgraded
17Reports • The key is to not just present meter data but to interpret it with respect to the situation in the real building • A number of report sets are being trialled to see which provide the information in the best form to allow decisions
Monitoring savings: Case Studies

• Building electrical savings of between 19% to 33% p.a.
• Building electrical savings/m2 between 61 to 100 kWh/m2/a
• In economic terms:
   • Measured recurrent savings of 9 to 14 EUR/m 2/a
   • Recorded ‘one-off’ setup costs between 0.1 to 2 EUR/m 2
   • Estimated 0.1 – 3 EUR/m2/a to maintain.
   • Net returns between 7 – 13 EUR/m2/a
• Success in reducing HVAC energy use is providing the
  confidence and finance (from savings) to tackle other
  electrical use as well

                                                           19
Monitoring - Conclusions
• Monitoring brings:
– Clarity and Certainty;
– Proven energy and cost savings to the end user and MS;
– End user engagement and ability to contribute to 2020 targets;
– Proof of impact achieved;
– Increased use of energy efficient products;
– Ability to use Smart Metering data which is coming.
• As a commercial prospect monitoring makes sense already.
• Monitoring is a step to nZEB, zero energy buildings and
active buildings.
20Thank you your attention!
Zoltan MAGYAR, PhD
zmagyar@invitel.hu
magyar@egt.bme.hu
www.iservcmb.info
21You can also read