Mexico Wheat 2021/22: Harvested Area Below 5-Year Average Due to Low Water Availability - USDA
←
→
Page content transcription
If your browser does not render page correctly, please read the page content below
Foreign Agricultural Service
Global Market Analysis
Commodity
International Production Assessment Division
Web: https://ipad.fas.usda.gov
Intelligence
September 17, 2021 Report
Mexico Wheat 2021/22: Harvested Area Below 5-Year Average
Due to Low Water Availability
USDA estimates Mexico’s marketing year 2021/22 wheat production at 3,100,000 metric
tons (MT), up about 5 percent from last year’s production. Though area has decreased
slightly from last year, it is about 10 percent below the 5 year-average at an estimated
555,000 hectares (ha). The yield estimate is up about 5 percent from last year at 5.59
tons per hectare (t/ha) (see Figure 1).
With most of the crop being irrigated, approximately 95 percent of wheat in Mexico is
planted in the winter from October through December and harvested from April through
June. The remaining wheat is mostly rainfed and is planted in the spring from April through
July and harvested in September through December. Sonora is the biggest producer
during the winter cycle for wheat, followed by Guanajuato, Baja California, Michoacán,
and Sinaloa. The largest producer for the spring wheat cycle is Tlaxcala (see Figure 2).
Winter weather was both harmful and beneficial for the wheat planted during this cycle.
Farmers were discouraged from planting wheat in various parts of Sonora due to drought
conditions throughout 2020. Although Mexico’s wheat crop is mostly irrigated,
precipitation before the season begins and temperatures and rainfall during the season
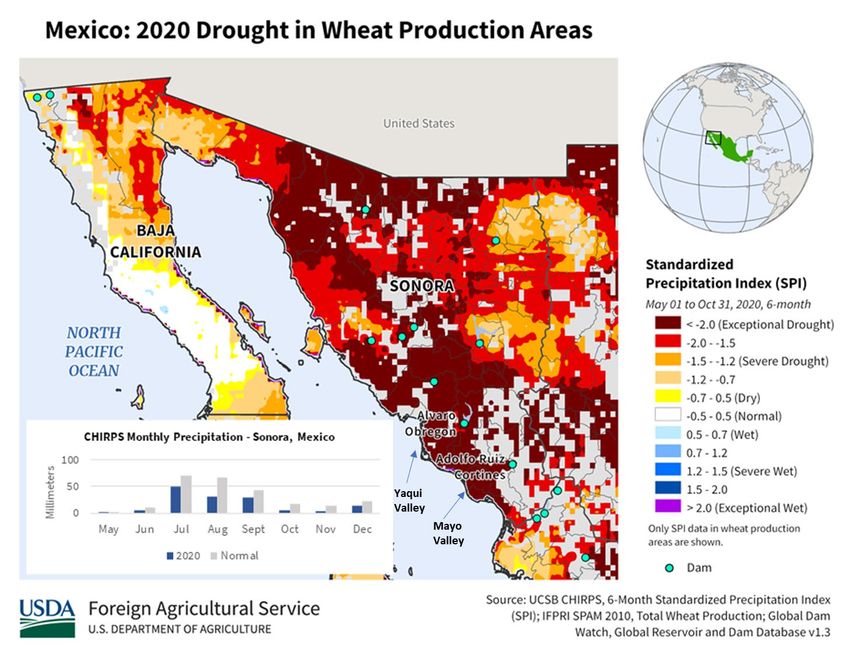
have a large impact on area and yield. Below average precipitation in Sonora, during the
rainy season from June to October 2020, resulted in low water availability overall for
irrigation, especially in the Mayo Valley (see Figure 3). According to Comisión Nacional
del Agua (CONAGUA), reservoir levels in the Adolfo Ruíz Cortínes dam in the Mayo
Valley were below 30 percent at the end of December 2020, which decreased wheat
planting intentions (see Figure 4). Furthermore, during the winter, wheat planting was
delayed in Sonora due to below-average rainfall in December 2020. However, dams in
the Yaqui Valley had sufficient water levels to support wheat plantings at the end of
December 2020, according to data from CONAGUA.
In Nuevo León, frost damage to wheat occurred from the winter storms in mid-February
2021 (see Figure 5). The Mexican government’s Servicio de Información Agroalimentaria
y Pesquera (SIAP) reported 5,101 ha of damaged area in Nuevo León as of August 31,
2021, which was about 74 percent of the planted area in the state.
However, as December 2020 ended, cool temperatures in Sonora delayed crop
development and increased biomass prior to wheat flowering. This resulted in high wheat
yields in Sonora (see Figure 6). In addition, average to above-average rainfall in mid-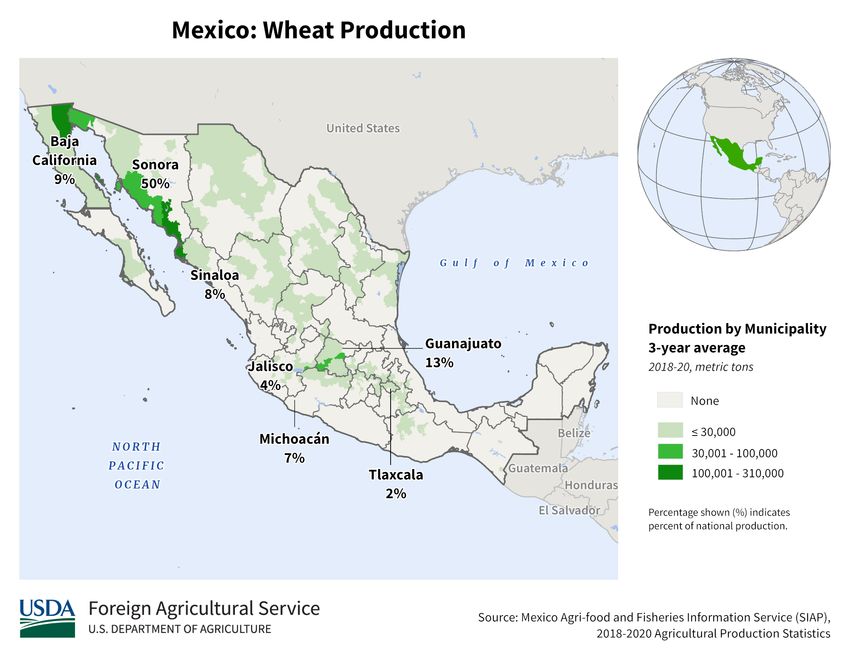
Commodity Intelligence Report                                           September 17, 2021

January 2021 throughout major wheat producing areas in Sonora, Baja California, and
Sinaloa helped to relive early season drought conditions (see Figure 7).

In major wheat producing areas in Sonora specifically, the satellite-derived Normalized
Difference Vegetation Index (NDVI) depicted above-average vegetation conditions at the
beginning of April 2021, after a slow start earlier in the season (see Figures 8 and 9).
According to data from SIAP, wheat yields in Sonora as of August 31, 2021 were the
highest in the country at 7.28 t/ha.

Harvest of the winter cycle wheat crop is over 98 percent complete. SIAP reported that
480,401 ha of the 486,830 ha wheat planted in the winter have been harvested with a
production of 3,143,441 MT as of August 31, 2021. In the state of Sonora, SIAP has
reported a production of 1,721,608 MT based on a harvested area of 236,467 ha for the
winter planted wheat, slightly higher than last year but about 21,530 ha lower than the 5-
year average. As of August 31, 2021, wheat production in Michoacán for this season is
the highest compared to the most recent years at 245,082 MT (see Figure 10).

For wheat planted in the spring, SIAP is reporting 65,679 ha planted so far as of August
31, 2021, currently about 6,000 ha lower than last year during this time. Tlaxcala leads
the planted area for this wheat cycle with 19,746 ha planted. Weather conditions have
been favorable in Tlaxcala as cumulative rainfall has been above-average as of August
2021 to support crop development (see Figure 11).

Overall, though the early season drought and limited water availability led to decreased
planted wheat area in the winter season, favorable weather conditions during the mid-late
season helped to boost crop yields and increase production.

                                                                                    2 of 11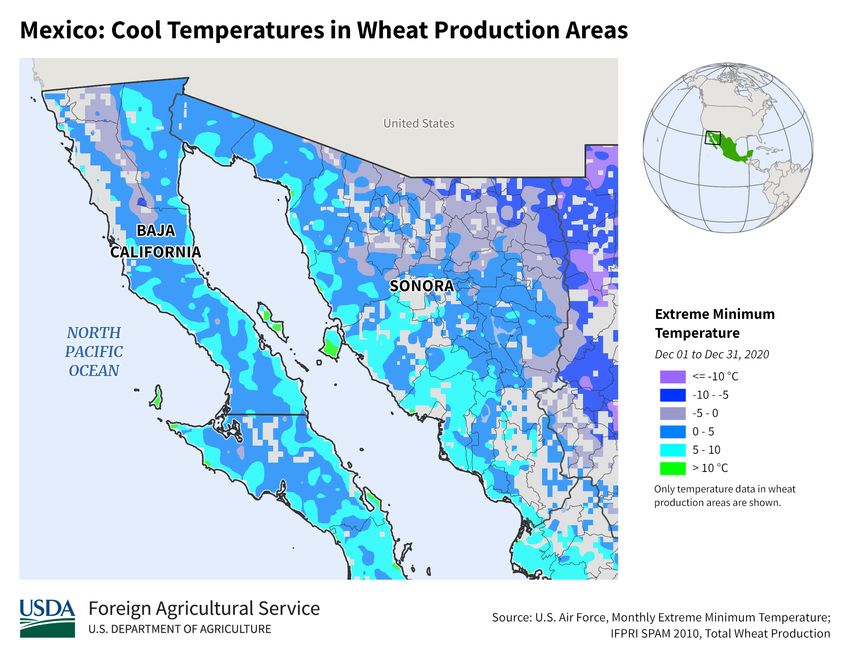
Commodity Intelligence Report                                                September 17, 2021

Figure 1. Annual Mexico Wheat Area, Yield, and Production Estimates from 2011-2021. Source: USDA
PSD Online.

Figure 2. Map of Average Mexico Wheat Production, 2018-2020. Source: SIAP.

                                                                                         3 of 11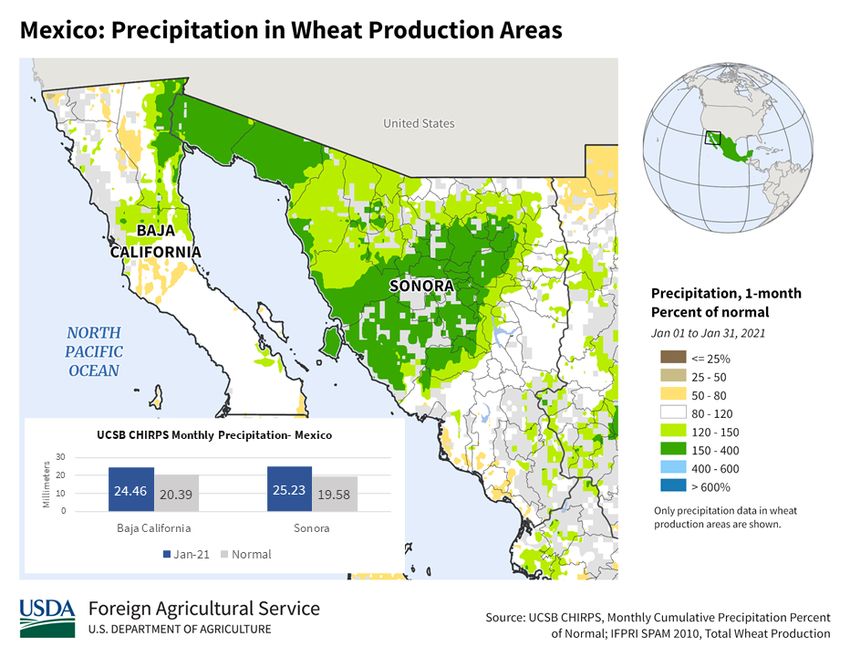
Commodity Intelligence Report                                                       September 17, 2021

Figure 3. Drought Conditions During 6 months (May 2020 – October 2020) in Mayo Valley and Yaqui Valley
in Sonora for Supplementing Water Levels for Wheat Irrigation. Bar Chart of Total Monthly Rainfall for May
– December 2020 in Sonora. Source: UC Santa Barbara Climate Research Group
.

                                                                                                   4 of 11
Commodity Intelligence Report                                                       September 17, 2021

Figure 4. Area for Wheat Planted in Winter in Sonora for 2017-2021. Source: SIAP.

                                                                                                5 of 11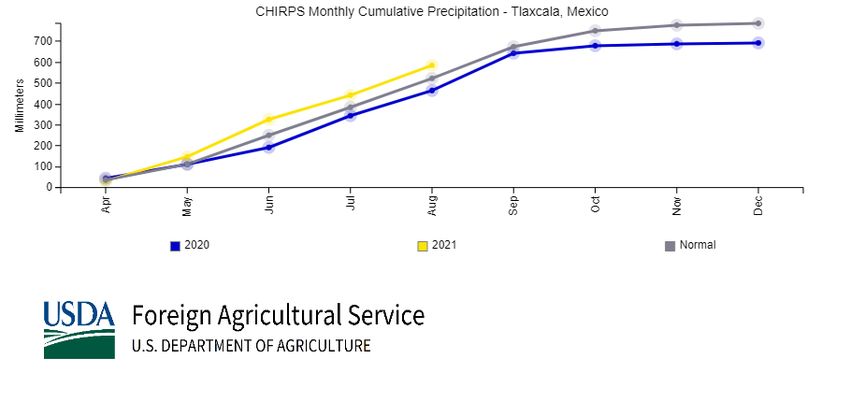
Commodity Intelligence Report                                               September 17, 2021

Figure 5. Frost Damage in Nuevo León with Major Damaged Wheat Areas Labelled. Snow Depth Average
– February 15 – 21, 2021. Extreme Minimum Temperature – February 15 – 21, 2021. Source: U.S. Air
Force.

                                                                                         6 of 11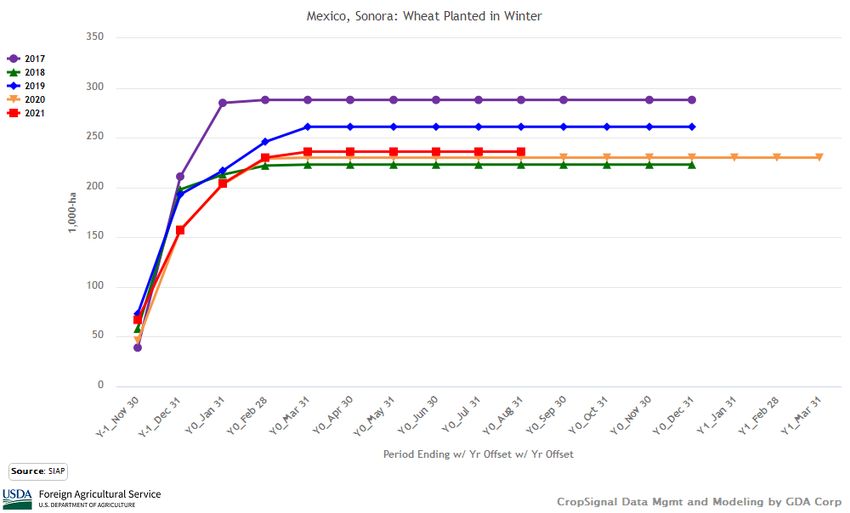
Commodity Intelligence Report                                              September 17, 2021

Figure 6. Cool Temperatures in Sonora in December 2020 Supported Higher Yields. Map of Extreme
Minimum Temperature in Major Wheat Areas in December 2020. Souce: U.S. Air Force.

                                                                                       7 of 11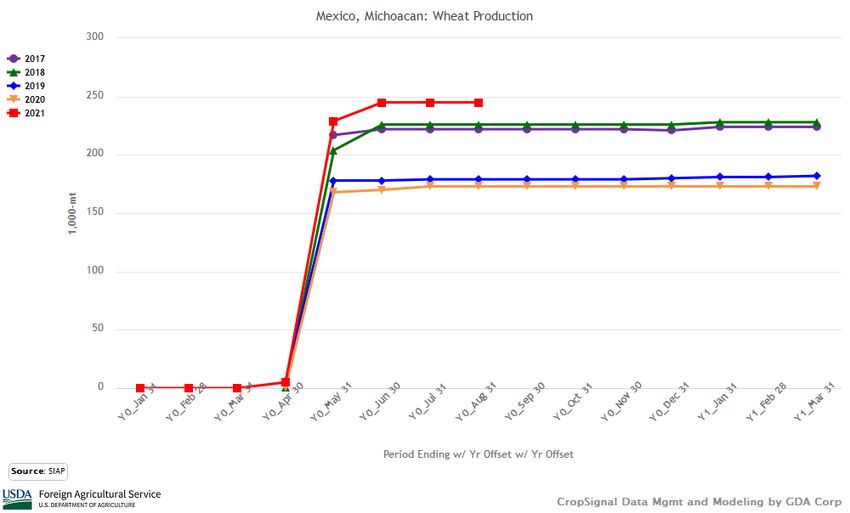
Commodity Intelligence Report                                                       September 17, 2021

Figure 7. Mid-January 2021 Rains Relieved Dry Conditions in Wheat in Sonora and Baja California, and
Sinaola. Map of Percent Normal Precipitation for Month of January 2021. Bar Chart of Monthly Precipitation
in Baja California and Sonora. Source: UC Santa Barbara Climate Research Group.

                                                                                                   8 of 11
Commodity Intelligence Report September 17, 2021
Figure 8. NDVI Map Depicting Vegetation Conditions of Wheat Area in southern Sonora, Mexico during
Week of March 30 – April 6, 2021. Source: USDA/NASA NDVI Anomaly, Global Agricultural Monitoring
(GLAM) System.
9 of 11Commodity Intelligence Report September 17, 2021
Figure 9. NDVI Chart of Wheat Growing Areas in Sonora, Mexico comparing 2019-2020 and 2020-2021
Conditions to Average Conditions. Source: USDA/NASA GLAM, MODIS 8-day NDVI.
Figure 10. Annual Wheat Production in Michoacán for 2017-2021. Source: SIAP.
10 of 11Commodity Intelligence Report September 17, 2021
Figure 11. Line Chart of Cumulative Rainfall Conditions in Tlaxcala during Summer 2020 and 2021
Compared to Normal. Source: UC Santa Barbara Climate Research Group.
Author contact information:
Ifeoma Collins
ifeoma.collins@usda.gov
For more information and to access FAS databases and reports please visit:
Current World Agricultural Production Reports
https://www.fas.usda.gov/data/world-agricultural-production
Production, Supply and Distribution Database (PSD Online)
https://apps.fas.usda.gov/psdonline/app/index.html#/app/home
Global Agricultural Information Network (Agricultural Attaché Reports)
https://www.fas.usda.gov/databases/global-agricultural-information-network-gain
Crop Explorer
https://ipad.fas.usda.gov/cropexplorer/
Global Agricultural and Disaster Assessment System (GADAS)
https://geo.fas.usda.gov/GADAS/index.html
11 of 11You can also read