The Contribution made by Beer to the European Economy - Germany - March 2020 - The Contribution made by Beer to the European ...
←
→
Page content transcription
If your browser does not render page correctly, please read the page content below
The Contribution made by Beer
     to the European Economy
                 Germany - March 2020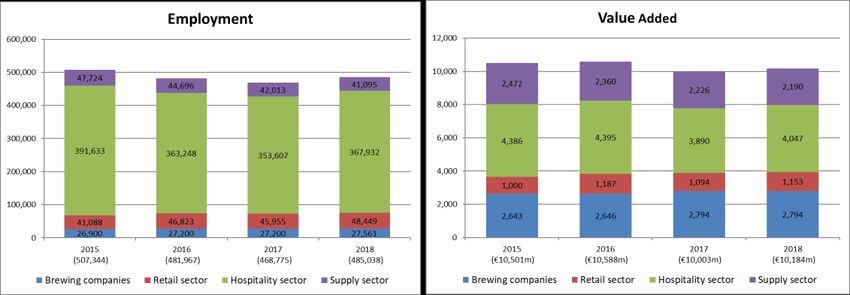
Germany
1 | Country profile
…………………………………………………………………………………………………………………………………………………………

Table 1: Country profile
Germany                                                                         2018
Population                                                                   82,792,351
Currency                                                                        Euro
GDP per capita in PPS (2012, EU28 = 100)                                         122
Source: Eurostat and National Statistical offices.

2 | Highlights Germany
…………………………………………………………………………………………………………………………………………………………

Table 2: Economic impact summary (and % change over the period)
                                                       Germany      2015       2016        2017      2018
Total number of jobs                         [-4.4%]               507,344    481,967     468,775   485,038
Value-added (mEuro)                          [-3%]                 10,501     10,588      10,003    10,184
Government revenues (mEuro)                  [2.2%]                 6,307      6,325       6,255     6,444
Source: Calculations - different sources.

The production in Germany is greater than its consumption need, with the difference owing to a
very active exporting sector. Overall, production and total exports have remained broadly stable
2014-2018, but the destination of its exports seem to have changed recently, with a greater share
of exports being sold to other non-EU countries.
Figure 1: Evolution of main indicators (2014-2018)

Source: National associations.

The Contribution made by Beer                                    Germany                                  Page 1
to the European Economy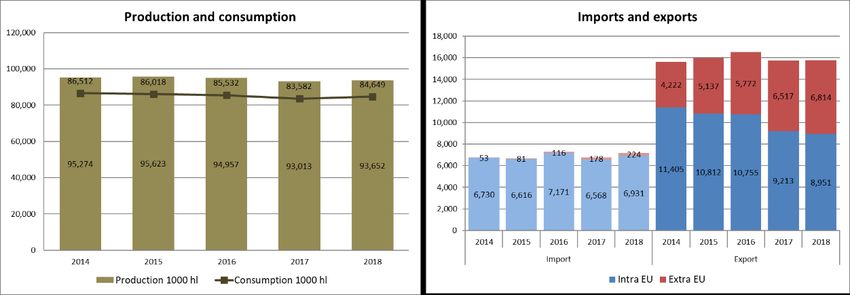
3 | A snapshot of the brewing sector
…………………………………………………………………………………………………………………………………………………………

Germany continues to top the leader-board of beer production in Europe with a vast 9.3 billion
litres of beer produced in 2018. Microbreweries, already a large proportion of the total number of
breweries (1,539), grew to number 853 in 2018.

Table 3: Basic characteristics of the beer sector (2015-2018)
                                                      Germany      2015         2016         2017         2018
Total production (in hectolitres)                               95,623,000   94,957,000   93,013,000   93,652,000
Brewing companies                                                   N/A          N/A          N/A          N/A
Breweries (including microbreweries)                               1,392        1,411        1,500        1,542
Microbreweries                                                      723          740          832          854
Source: National Associations.

4 | Looking at the beer market
…………………………………………………………………………………………………………………………………………………………

Domestic consumption trails production by nearly one billion litres. Although falling marginally
over time, Germans are among the most enthusiastic beer-drinkers in Europe, consuming over
100 litres of beer annually. Over four-fifths of this consumption occurs with beer bought in the
retail sector.

Table 4: Basic characteristics of the beer market (2015-2018)
                                                      Germany      2015         2016         2017         2018
Total consumption in hectolitres                                86,018,000   85,532,000   83,582,000   84,649,000
Total consumer spending (in million Euro)                         19,595       19,655       19,344       20,243
Consumption of beer per capita (in litres)                          106          104          101          102
Beer consumption hospitality                                       19%          18%          18%          18%
Beer consumption retail                                            81%          82%          82%          82%
Consumer price hospitality (€ / litre)*                            7.30         7.30         7.30         7.50
Consumer price retail (€ / litre)*                                 1.10         1.20         1.22         1.27
Note: * Prices are averages inclusive of taxes and duties.
Source: National Associations.

The Contribution made by Beer                                   Germany                                       Page 2
to the European Economy
5 Trends and developments
…………………………………………………………………………………………………………………………………………………………
Although accounting for over 80% of beer consumption, the total value of the retail sector still
lags behind that of the hospitality sector (although they appear to be converging slowly).
Germany is a leader in the production and consumption of craft beer. Lovers of variety in their
drinking habits, Germans consumed 304m litres of craft in 2016, the largest in Europe.1 The
brewers association, Deutscher Brauer-Bund – Die deutschen Brauer, also noted an uptick in the
market share of canned beer from 4.1% in 2015 to 5.5% in 2018.
Figure 2: Recent consumption trends (2013-2018)
Source: National Associations.
The total purchases of inputs into the production of beer reached above the €500m mark in 2016,
returning to a level slightly below in 2017 and 2018. Most of such inputs are domestic, which
makes beer an important contributor to the German economy.
Figure 3: Importance up the chain
Note: AG – Agriculture; UT – Utilities; PK – Packaging; EQ – Equipment; TR – Transport; MM – Media / marketing; SO – Other services.
Source: Calculations based on data from Eurostat, and the Individual Brewers Questionnaire.
1
Zenith: Craft beer in Europe.
The Contribution made by Beer Germany Page 3
to the European Economy6 | The impacts beyond the sector: related jobs and value added ………………………………………………………………………………………………………………………………………………………… As can be expected in Europe’s largest beer-producing nation, the highest number of jobs associated with beer was found in Germany. In 2018 More than 480,000 people’s jobs were supported directly or indirectly by the beer production chain. This is lower than the total at the beginning of the period in which around 500,000 jobs were in this position. Despite the amount observed as purchases from a range of inputs, the high productivity in such sectors translate to few jobs up the stream (in particular, compared to lower productivity multipliers in the hospitality sectors, the impacts in the supply sectors are dwarfed). Value added, too, fell slightly over the period, from €10.5 billion in 2015 to €10.2 billion in 2018. Figure 4: Change in employment and value added (2015-2018). Note: The figures in the employment chart are to be considered as estimates. Source: Calculations based on data from Eurostat, National Associations, and the Individual Brewers Questionnaire. The employment in the supply sector can be broken down using the estimates from the responses to the survey to brewers. These imply a job breakdown of: 13,097 jobs in agriculture, 6,827 jobs in packaging, 8,126 jobs in transport, 2,048 jobs in media and marketing (the remaining corresponding to utilities, equipment, other). The Contribution made by Beer Germany Page 4 to the European Economy
7 | Government revenues related to beer
…………………………………………………………………………………………………………………………………………………………

Half of the total of nearly €6.5 billion in tax revenue generated by the beer industry is collected
from the sale of beer in the retail and hospitality sectors. The remaining half originates from the
labour tax contributions and excise duty payments.

Figure 5: Government revenues generated by beer in 2018

Source: Calculations based on data from Eurostat, and the National Associations.

The large employment contribution of the German beer industry means in turn that it collects
large sums of tax revenue on behalf of the government. Taxes on income, payroll, and social
security contributions (IPASS) collected by brewers and other sectors totalled above €2 billion
each year for the duration of the period in this study.

Table 5: Government revenues, mEuro (2008-2012)
                                                    Germany           2015         2016    2017    2018
Excise duties                                                          676          678     664     655
VAT Hospitality                                                       1,905        1,794   1,754   1,825
VAT Retail                                                            1,224        1,344   1,335   1,407
IPASS (brewing companies)                                              613          611     617     617
IPASS (other sectors)                                                 1,889        1,897   1,885   1,940
Total government revenues                                             6,307        6,325   6,255   6,444
Source: Calculations - different sources.

Die deutschen Brauer has also commented that the Small Brewers’ Relief has been warmly
welcomed. It enables small brewers to compensate at least in part for their cost disadvantage
compared with their larger, more powerful competitors.

The Contribution made by Beer                                     Germany                                  Page 5
to the European Economy
The Brewers of Europe Rue Caroly 23 - 25 1050 Brussels - Belgium T + 32 (0)2 551 18 10 www.brewersofeurope.org info@brewersofeurope.org © Published March 2020
You can also read