The Contribution made by Beer to the European Economy - Czech Republic - March 2020 - The Contribution made by Beer to the ...
←
→
Page content transcription
If your browser does not render page correctly, please read the page content below
The Contribution made by Beer
     to the European Economy
              Czech Republic - March 2020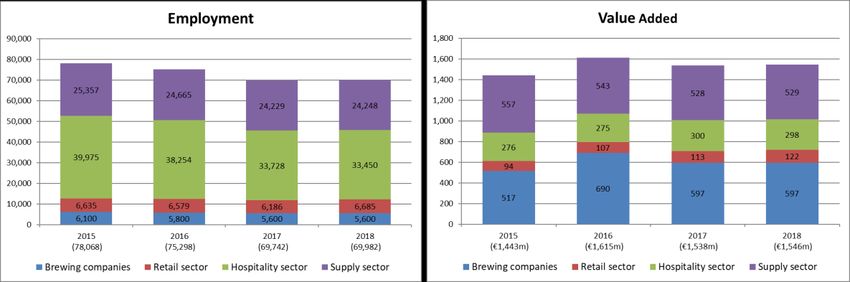
Czech Republic
1 | Country profile
…………………………………………………………………………………………………………………………………………………………

Table 1: Country profile
Czech Republic                                                                        2018
Population                                                                         10,610,055
Currency                                                                             Koruna
GDP per capita in PPS (2012, EU28 = 100)                                               91
Source: Eurostat and National Statistical offices.

2 | Highlights Czech Republic
…………………………………………………………………………………………………………………………………………………………

    Table 2: Economic impact summary (and % change over the period)
                                                       Czech Republic      2015        2016      2017     2018
    Total number of jobs                        [-10.4%]                  78,068      75,298    69,742   69,982
    Value-added (mEuro)                         [7.1%]                     1,443       1,615    1,538     1,546
    Government revenues (mEuro)                 [8.5%]                      936         956      985      1,015
    Source: Calculations - different sources.

Total production of beer in the Czech Republic has risen steadily over the period 2014-2018. The
increase was such that even Eurostat, the EU’s statistics agency, congratulated the Czech Republic’s
promising production growth to mark International Beer Day 2019.1 As domestic consumption
continues to lag behind production, an increasingly large volume of Czech beer is exported to other
European countries.
Figure 1: Evolution of main indicators (2014-2018)

Source: National associations.

1
    European Union (2019) “Eurostat publishes data to mark International Beer Day”.

The Contribution made by Beer                                 Czech Republic                                  Page 1
to the European Economy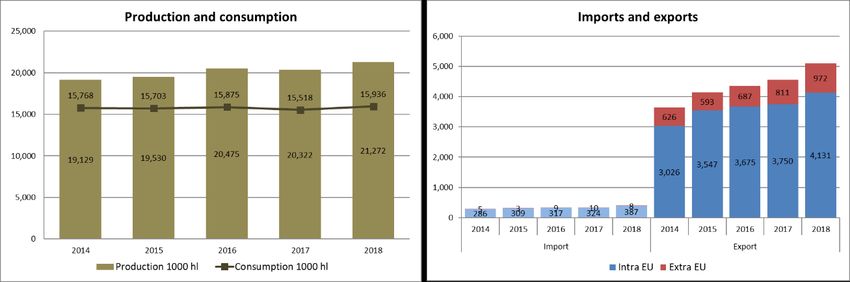
3 | A snapshot of the brewing sector
…………………………………………………………………………………………………………………………………………………………

Total production, at 21 million hectolitres, keeps the Czech Republic in the top ten beer-producing
countries in Europe. The total number of breweries has climbed, largely driven by an explosion in
the number of microbreweries. These numbered 202 in 2015 but more than doubled to 440 by
2018.

 Table 3: Basic characteristics of the beer sector (2015-2018)
                              Czech Republic                     2015               2016          2017         2018
 Total production (in hectolitres)                            19,530,000         20,475,000    20,322,000   21,272,000
 Brewing companies                                                374                385           437          475
 Breweries (including microbreweries)                             390                398           450          488
 Microbreweries                                                   202                350           402          440
 Source: National Associations.

4 | Looking at the beer market
…………………………………………………………………………………………………………………………………………………………

Both total consumption and consumer spending have risen over the period. Czechs top the
leaderboard in consumption of beer per capita in Europe, but there are signs that domestic
consumption growth may slow as consumers are beginning to each drink less beer. In contrast to
other European countries, average prices of beer have changed relatively little over the four-year
period. The retail price remains below 90 cents per litre.

 Table 4: Basic characteristics of the beer market (2015-2018)
                                 Czech Republic                   2015              2016         2017          2018
 Total consumption in hectolitres                              15,703,000        15,875,000   15,518,000    15,936,000
 Total consumer spending (in million Euro)                        2,107             2,117        2,216         2,272
 Consumption of beer per capita (in litres)                        143               143          138           141
 Beer consumption hospitality                                      40%               39%          38%           36%
 Beer consumption retail                                           60%               61%          62%           64%
 Consumer price hospitality (€ / litre)*                          2.11              2.12         2.33          2.38
 Consumer price retail (€ / litre)*                               0.83              0.83         0.87          0.89
 Note: * Prices are averages inclusive of taxes and duties.
 Source: National Associations.

The Contribution made by Beer                                   Czech Republic                                      Page 2
to the European Economy
5 Trends and developments ………………………………………………………………………………………………………………………………………………………… The share of domestic consumption occurring in the retail sector is slowly reaching two-thirds of the total. Combined with the slight retail price increases, the value of the retail sector is steadily catching up with that of the hospitality sector. Figure 2: Recent consumption trends (2013-2018) Source: National Associations. Czech brewers support a host of sectors in the domestic economy, from agriculture for the hops used in the production of world-famous pilsner, to the media and marketing services to promote it across the globe. Overall, the total amount of purchases increased over time to just below €1,600 million in 2017 and 2018 and the main trends see an increase in the share of packaging and a reduction in the media and marketing expenditure. Figure 3: Importance up the chain Note: AG – Agriculture; UT – Utilities; PK – Packaging; EQ – Equipment; TR – Transport; MM – Media / marketing; SO – Other services. Source: Calculations based on data from Eurostat, and the Individual Brewers Questionnaire. The Contribution made by Beer Czech Republic Page 3 to the European Economy
6 | The impacts beyond the sector: related jobs and value added
…………………………………………………………………………………………………………………………………………………………

The slow contraction of the beer hospitality market has meant that total employment related to
beer has been falling over recent years.

Value added, on the other hand, remains stable at around €1.5 billion in total, with a €1.6billion
peak in 2016. The lion’s share of this value is produced by the brewing companies (just below
€600 million in 2018), who can make use of the unique beer (“pivo”) production to sustain their
value added, and the supply sector (which accounted for more than €500 million in 2018).

Figure 4: Change in employment and value added (2015-2018).

Note: The figures in the employment chart are to be considered as estimates.
Source: Calculations based on data from Eurostat, National Associations, and the Individual Brewers Questionnaire.

The employment in the supply sector can be broken down using the estimates from the responses
to the survey to brewers. These imply a job breakdown of: 5,839 jobs in agriculture, 3,803 jobs in
packaging, 3,873 jobs in transport, 7,065 jobs in media and marketing (the remaining
corresponding to utilities, equipment, other).

The Contribution made by Beer                                  Czech Republic                                        Page 4
to the European Economy
7 | Government revenues related to beer
…………………………………………………………………………………………………………………………………………………………

Almost a third of the government revenues from the production and sale of beer is sourced
through the IPASS amongst the supply sectors upstream, while excise duties and the VAT from pubs
and hotels combined account for more than 40% of the total.

Figure 5: Government revenues generated by beer in 2018

Source: Calculations based on data from Eurostat, and the National Associations.

Total tax receipts from the Czech beer industry climbed to €1,015 million in 2018, from €936million
in 2015.

The Czech parliament has recently voted to approve a bill drafted by the country’s Ministry of
Finance to lower the VAT rate on draft beer from 21% to 10%.2 This may help to shore-up the value
of the hospitality beer market in the coming years.

    Table 5: Government revenues, mEuro (2015-2018)
                                                Czech Republic         2015        2016   2017   2018
    Excise duties                                                      170         170    172     190
    VAT Hospitality                                                    230         228    239     237
    VAT Retail                                                         136         139    146     158
    IPASS (brewing companies)                                          105         112    118     118
    IPASS (other sectors)                                              295         306    311     312
    Total government revenues                                          936         956    985    1,015
    Source: Calculations - different sources.

2
    Jaroslaw Adamowski (2019) “Czech lawmakers vote to cut VAT on draft beer and restaurants”.

The Contribution made by Beer                                    Czech Republic                      Page 5
to the European Economy
The Brewers of Europe Rue Caroly 23 - 25 1050 Brussels - Belgium T + 32 (0)2 551 18 10 www.brewersofeurope.org info@brewersofeurope.org © Published March 2020
You can also read