Overview - The EU SVOD market Facts & Figures - A presentation - Coe
←
→
Page content transcription
If your browser does not render page correctly, please read the page content below
Overview – The EU SVOD market
           Facts & Figures

                                           Christian Grece
                                                   Analyst
                                           th
                                         10 October 2018
                                              WCOS - Berlin

A presentation
     of the European Audiovisual Observatory
Overview - The EU VOD market in figures - explosive growth over 5 years Focus on SVOD - the fastest growing audiovisual market segment TV fiction and feature film production in the EU
1– Overview– Main points Overview
Rapid market growth of paid VOD services
Launch of new services by traditional and new media players
Expansion of international players into the EU, alliances of EU players
Rapid consumer adoption & changing expectations/behaviour (ATAWAD)
‘Over-the-Top’ distribution and use of multiple media devices become
generalised with widespread broadband
Abundance of content / Scarcity of consumer attention
VOD market mainly driven by SVOD services as consumer prefer
increasingly access to content over ownership
However, VOD market still a small segment of the EU audiovisual market
and dominated by a few
1 – EU VOD market – Rapid growth over the past 5 years - SVOD growth driver                                         Overview

                              Consumer revenues OTT SVOD & TVOD
                                                    in EUR million

           6 000                                                                                     5 131
                                                                                                     million
           5 000

           4 000

                                                                                                    3 649,0
           3 000

           2 000   1 165
                   million

           1 000      363,7                                                                          865,7
                      550,1
                      251,2
                                                                                                    616,5
              0
               2013              2014                      2015                  2016                        2017

                                        TVOD - Retail     TVOD - Rental   SVOD

                                                                                        Source: Ampere Analysis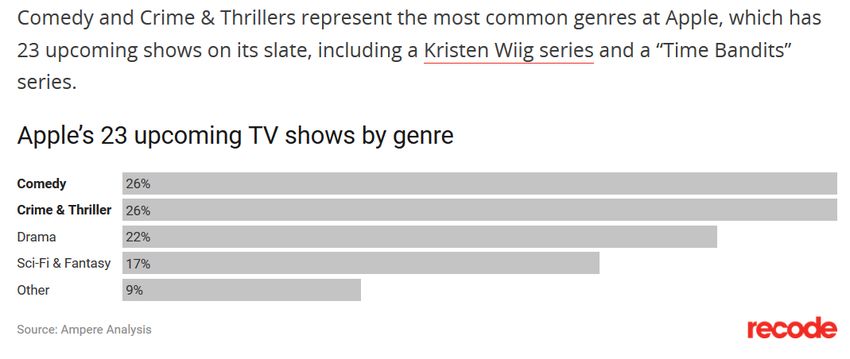
1 – EU VOD market – still a small part of the AV ecosystem (2016) Overview
Cinema gross Physical video (incl.
On-demand box-office taxes)
pay-revenues 6% 4%
3%
Public funding
23%
Representing in 2016 only 3% of the EUR 111,4
billion audiovisual market in the EU, on-demand pay
Pay-TV revenues services are still relatively small compared to other
31% Advertising TV markets.
28%
Advertising Radio BUT the dynamic is on the on-demand side as year-
36,9% 5% to-year growth rates are tremendously superior to
the other AV markets, and this still for a foreseeable
future with the launches of new on-demand services
and increased consumer adoption.
2,0% 1,8% 1,5%
On-demand pay- Advertising Radio Pay-TV revenues Advertising TV Public funding Cinema gross box- Physical video
revenues office (incl. taxes)
-0,5%
-2,3%
Source: IHS, Warc, EBU/MIS, OBS,
-17,7% Ampere Analysis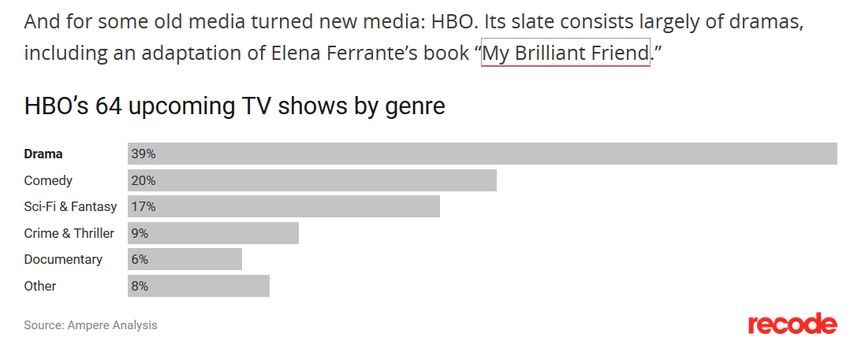
2. Focus on SVOD - the fastest growing audiovisual market segment
2– Focus on OTT SVOD – Main points Overview SVOD has become an established part of the EU audiovisual ecosystem with rapid growth in consumer revenues and subscribers This is launching a race towards ‘direct-to-consumer’ business models for media players, who have to adapt to consumer expectations In the EU at the end of 2017: 183 different SVOD services were available (representing 280 linguistic versions) (OBS - MAVISE stats) However, the sector is dominated by 2 players, Netflix and Amazon, which together account for 80% of SVOD subscriptions / 74% of revenues Increased investments in original content and in content acquisition by international players makes competition increasingly harder for smaller national players – Size matters / Alliances of EU players
2 - Focus on OTT SVOD – Revenues & Subscribers in 2017 by services

                                       SUBSCRIBERS                                                   CONSUMER REVENUES

 -    53,9 million SVOD subscribers in 2017                     -      EUR 3 649 million in 2017
 -    Netflix and Amazon represent 80% of EU SVOD subs          -      Netflix and Amazon represent 74% of EU SVOD revenues

                       15 other SVOD                                                TIM Vision 2%    13 other SVOD
                       services 8,8%                                                                  services 7%
           HBO 1,8%                                                                    HBO 2%
           IPLA 1,8%                                                                Movistar+ 2%
                                                                    Sky Online 2%
     Maxdome 2,1%
                                                                               C More 2%
TIM Vision 2,5%
                                                                             Viaplay 2%
 Now TV 2,7%
                                                                          Maxdome 2%

                                                Netflix 45,7%                            Now TV 5%
                                                                                                                                    Netflix 51%

                  Amazon 34,7%                                                              Amazon 23%

                                                                                                          Source: Ampere Analysis
2 – Focus on SVOD – Benchmark - the SVOD market by country in 2017
1 092 SVOD revenues in 2017, in EUR million
Revenues
- Largest markets generate the most revenues
854
- Nordic countries early adopters and quick growth
- In CEE, still modest revenues and penetration –
late entry/localisation of services?
254 243
213 203 193
157
100
74 58 46 30 26 22 18 14 11 9 7 5 5 5 4 2 2 1 1
GB DE FR SE ES DK IT NL PL FI BE AT IE RO PT CZ GR HU SK BG LU SI HR LT LV EE CY MT
Penetration
- Room for further growth in all markets as
Penetration of SVOD - RGUs per 100 households
broadband becomes commodity + new and niche
66
services launches
59
- SVOD stacking – SVOD consumers start to
subscribe to more than 1 SVOD service, global
42
average of 2 per HH
33 32 31 - Distribution of SVOD services on pay TV platforms
24
21
& Amazon Channel could grow this trend
19 17 17 16
13 13 12
9 9 9 8
6 6 6 6 6 6 5 5 5
DK GB SE FI DE NL LU IE AT BE PL ES IT FR SI PT MT SK RO CZ HR CY LT GR EE LV HU BG2 – Focus on SVOD – Evolution - Content spend by major players
ARPU 18,3 ARPU in EUR/month
- SVOD and direct-to-consumer business have much
lower revenues per user
- The challenge will be for traditional services to 10,5
continue to finance content while earning less per
subscriber in new business models 6,7
4,9
- The need for size and presence in several markets
OR to distribute original content wider
Collaborations, coproductions and alliances
SVOD - Western Pay TV - Western SVOD - Central and Pay TV - Central
Europe Europe Eastern Europe and Eastern Europe
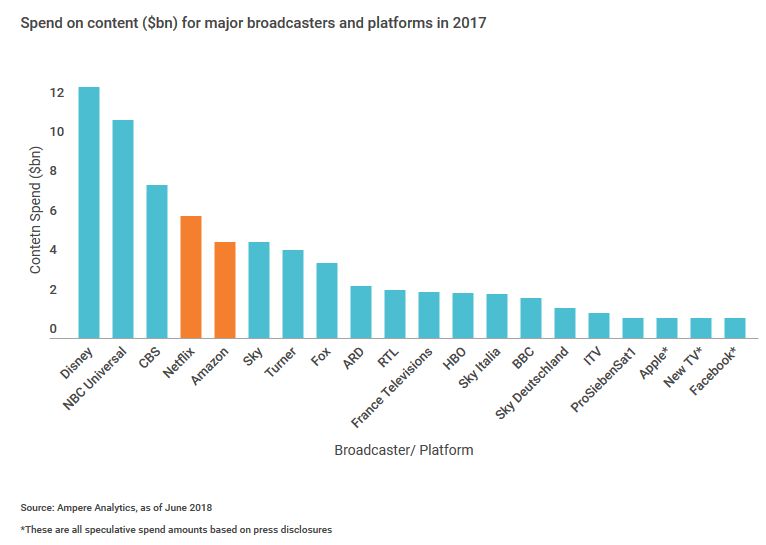
CONTENT SPEND
- Netflix spent USD 6,2 billion and Amazon USD 4,9
billion in 2017 on original and acquired content
- This compares to USD 4,8 billion for Sky, USD 2,2
billion for Sky Italia and USD 1,5 for Sky Germany
- With new mega deals for content creators in the
100s of million dollars and the rising costs of
premium content, traditional players will be
challenged
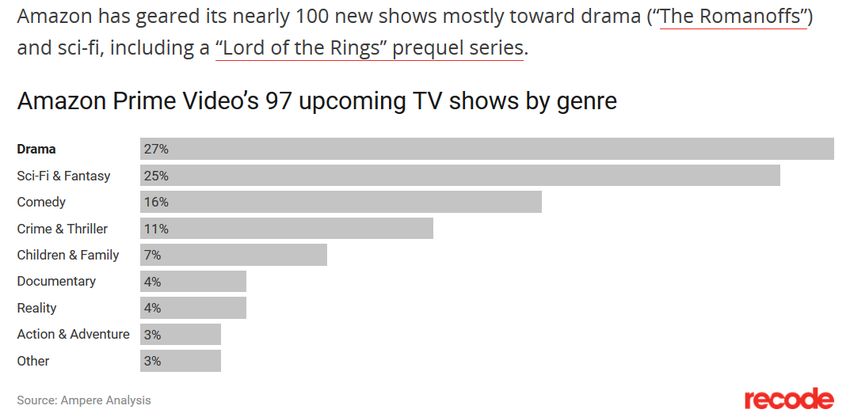
Source: Ampere Analysis2– Focus on OTT SVOD – Genres of new original TV show production
3. Production of TV fiction and feature films in the EU
3 – Production volume in the EU of TV fiction 2015/2016
       • Over 920 titles produced each year accounting for over 11 100 hours
             -> TV movies (one or two parts) account for 44% of all titles
            -> Series with more than 52 episodes per year account for 7% of titles but 60% of
       hours produced (telenovelas).
            -> Series between 3 and 13 episodes per year account for 41% of titles and 21% of
       hours produced

            Number of TV fiction titles produced (av. 2015-2016)           Hours of TV fiction produced (av. 2015-2016)

                                         67                                                            650
                                    28
                               47                                                                                      2381

                                                      404

                                                                                     6707                          684

                                                                                                                 763
                         378

              1-2    3 to 13        14 to 26   27 to 52     More than 52   1-2   3 to 13    14 to 26         27 to 52         More than 52

Source: European Audiovisual Observatory
3 – Focus on Series 3 to 13 episodes in the EU – SVOD services still marginal
• Public broadcasters are the leading originators of TV series, both in number of titles
(64%) and number of hours (62%)
• SVOD (still) marginal in 2015-2016
TV fiction titles by statute of first broadcaster TV fiction hours by statute of first broadcaster
3 to 13 episodes (av. 2015-2016) 3 to 13 episodes (av. 2015-2016)
135 46
23 11
Public TV Public
104 Private TV (Free) 716 Private/Free
Private TV (Pay) Private/Pay
241 SVOD 1485 SVOD
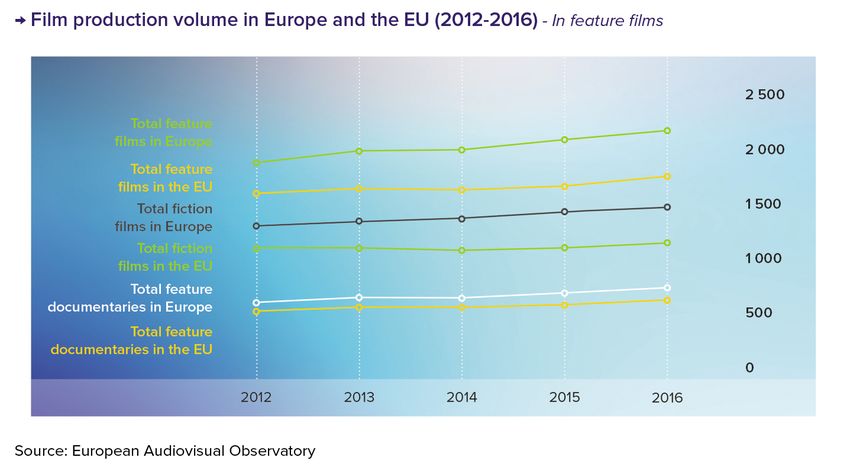
Source: European Audiovisual Observatory3 – Production volume in the EU of feature films 2012-2016 • 1 669 feature films produced in the EU in 2016, +5,2% y-o-y growth (1 137 fiction films and 532 feature documentaries)
More information:
      www.obs.coe.int
Christian.Grece@obs.coe.int
You can also read