Big Data und der Lockdown: Eine Verkehrsanalyse in Europa - Holger Hochgürtel, Director Sales
←
→
Page content transcription
If your browser does not render page correctly, please read the page content below

Big Data und der Lockdown:

                               Eine Verkehrsanalyse in Europa

Holger Hochgürtel, Director Sales
holger.hochguertel@inrix.com
INRIX Technology Platform
    Unique big data and analytics platform ingests multiple data feeds

Incident data
                 Mobile data
                                  Parking data                                                                                    Traffic                        Parking
                                                   Weather data
                                                                                                                                             Autonomous
 Historical        Event data
traffic data
                                                     Fleet data                                                                 OpenCar                           Analytics
                                Consumer vehicle
                                   GPS data
                Road sensors
Cell Tower
  Data
                     Massive Input Data                                     Technology Platform                                      Applications & Solutions

          • Global geo-spatial platform for location based services • Massive real-time data aggregation and processing • Analytics capabilities on 10 years of historical data

2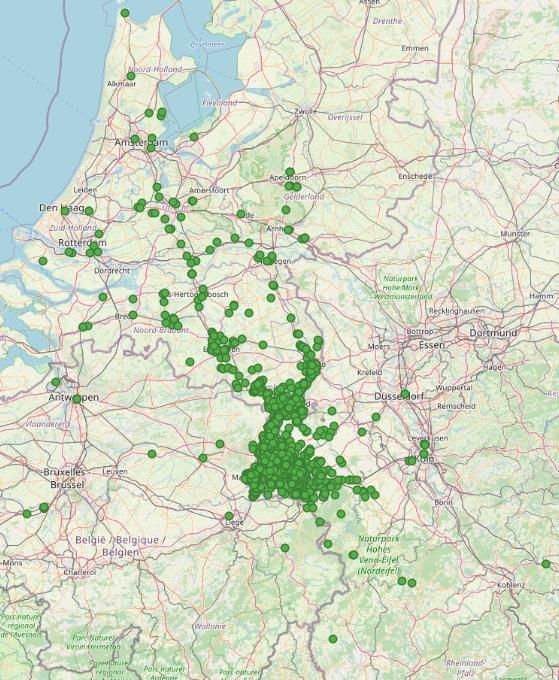
INRIX Trips Data
Aggregating crowdsourced anonymous trips enables new mobility use cases
Impact of COVID-19
Normalisierte Fahrzeug-Km (PKW) in Deutschland                          Fahrleistung während Lockdown geht teilw. bis
                                                                        auf 20% des Vor-Lockdown-Niveaus.
                                             20.05.                     Back-to-normal nun leicht unter Vor-Corona-Niveu
                                             Langes Wochenende
     16.03.
                                             Himmelfahrt    30.5.
     Schulen, Kindergärten, etc.
     Begin Lockdown              01.05.                     Pfingsten
                                 Langes Wochenende
                                 Maifeiertag
                       10.04.
                       Ostern

4
Impact of COVID-19
Normalisierte Fahrzeug-Km (PKW) in Deutschland

                                                 Wie wirkt sich der neue Lockdown-Light aus?

5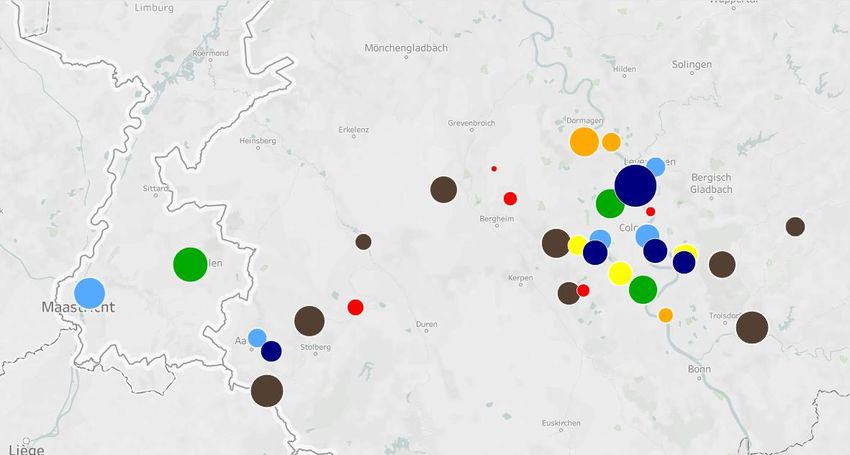
Impact of COVID-19
Normalisierte Fahrzeug-Km (LKW) in Deutschland
                                            20.05.
                                            Langes Wochenende
     16.03.
                                            Himmelfahrt
                                                                      Die Logistik bleibt „unberührt“ vom Lockdown
     Schulen, Kindergärten, etc.
     Begin Lockdown              01.05.
                                 Langes Wochenende        30.5.
                                 Maifeiertag              Pfingsten
                       10.04.
                       Ostern

6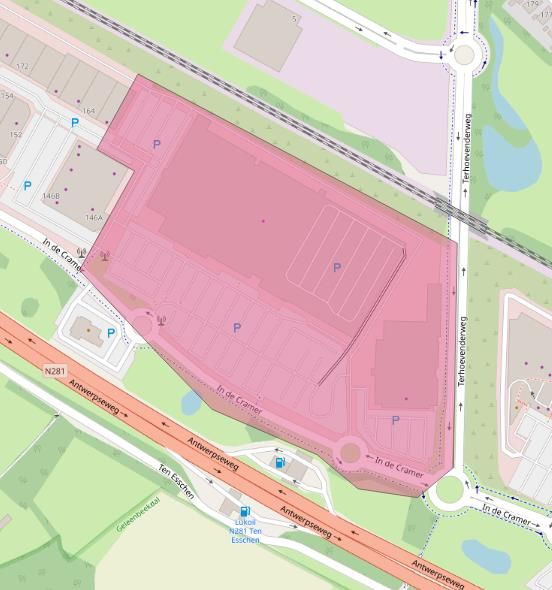
Impact of COVID-19
Normalisierte Fahrzeug-Km: Deutschland vs Italien
                                                    Tieferer Einschnitt aber „back to normal“ paralell
            Deutschland                             und auf gleichem Niveau wie in D
            Italien

7
Impact of COVID-19
Normalisierte Fahrzeug-Km: Deutschland vs UK
                                               „Back to normal“ verläuft langsamer und bleibt
           Deutschland                         auf niedrigerem Niveau
           UK

8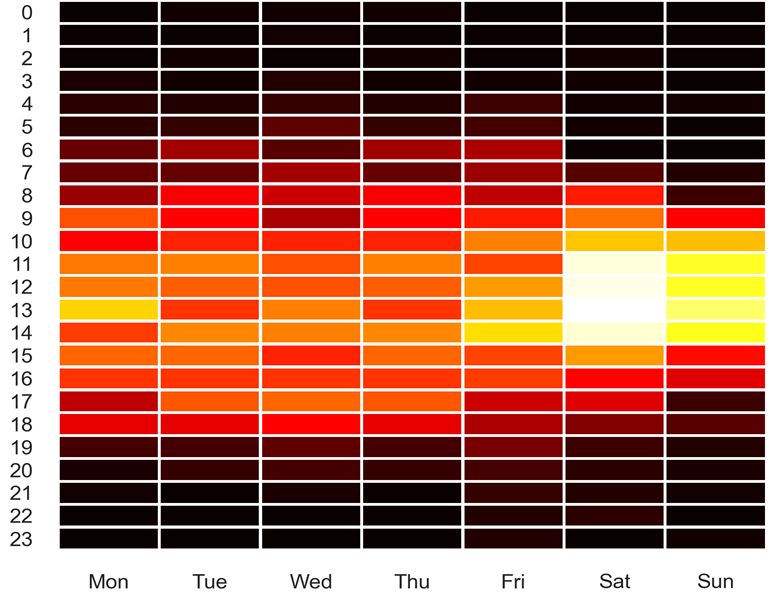
Impact of COVID-19
Normalisierte Fahrzeug-Km: Deutschland vs Frankreich
                                                       Tieferer Einschnitt, „back to normal“ verläuft
           Deutschland                                 Langsamer, übertrifft aber „Vor-Corona-Zeit“
           Frankreich

9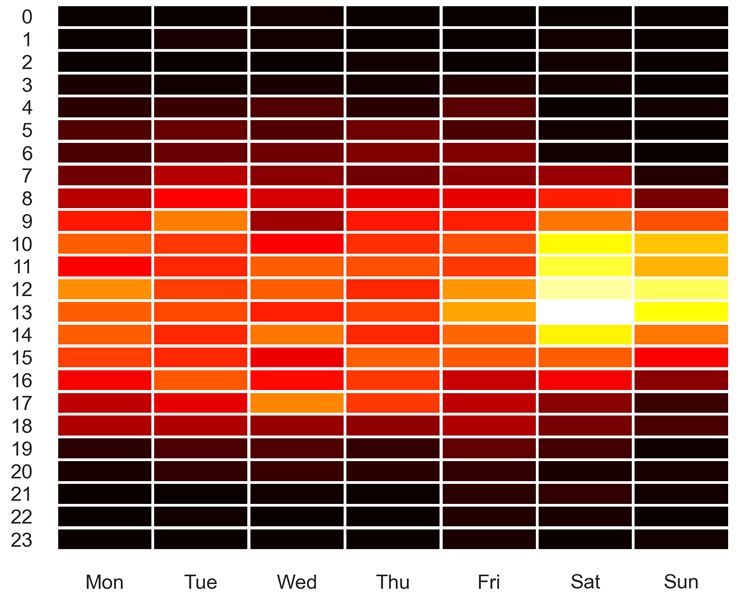
Impact of COVID-19
Normalisierte Fahrzeug-Km: Deutschland vs Spanien   Der tiefste Einschnitt, back to normal“ verläuft
                                                    langsamer und bleibt auf leicht niedrigerem Niveau
           Deutschland

           Spanien

10
INRIX Trips data: view per industry type 1/2
• Upper graph: Locations of selected points of interest (PoI) and PoI-Category
categorized by industry type (below table). The size of the
circle represents the trips started or ended at the considered
PoI from 24th Feb to 3rd May 2020.
• Lower graph: Count of all trips to/from all PoIs per category,
from 24th Feb to 3rd May 2020.
Automotive Chemical Energy
Continental Aachen Rothe Erde Bayer AG Hitdorf Rheinenergie Koeln Niehl
DeutzAG Chem-park Dormagen RWE Huerth Knappsack
Ford Koeln Evonik Niederkassel RWE Neurath
Toyota Deutschland Koeln Lanxess Leverkusen1 RWE Niederaußem
VW OTL Vertriebszentrum Lanxess Leverkusen2 RWE Weisweiler
Furniture Logistics Sport Aggregated trip count
(aggregation time frame: 24th Feb to 3rd May)
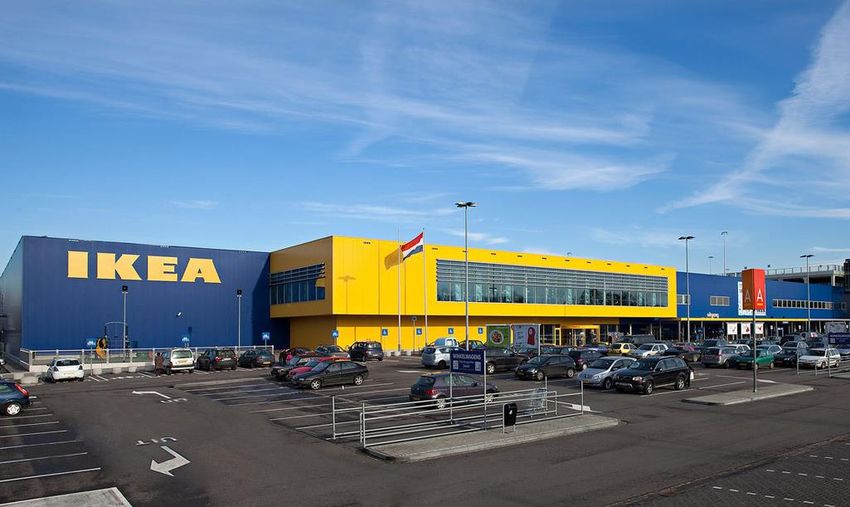
IKEA Hasselt Dachser SE Logistikzentrum Bay-Arena Leverkusen
IKEA Heerlen DHL Koeln Lanxess Arena Koeln
IKEA K-Am Butzweilerhof DHL-freight Koeln Longerich Rhein Energie Station Koeln
IKEA Koeln Godorf Lekkerland Logistikzentrum Stadium MVV Maastricht
IKEA Liege Saint Global Zentrallager Tivoli Alemania Aachen
11 11INRIX Trips data: view per industry type 2/2
Aggregated trip count prior to lockdown measures
(aggregation time frame: 3rd Mar to 8th Mar
Upper graph: Count of trips per PoI Categorie for one week prior to
the lockdown measures (3rd March to 8th March).
Lower graph: Count of trips per PoI Categorie for one week after to
the lockdown measures (13th April to 18th April 2020).
The graphs suggest following readings:
▪ Different industries differently affected. While the number of
trips starting and ending at energy PoIs was marginally
reduced (4%), the number of trips at automotive PoIs was
heavily affected with a reduction of 58%. Reduction Aggregated trip count Prior to lockdown measures
by 58% (aggregation time frame:13th Apr to 18th May)
▪ This is due to the fact that the work had to be continued at
power plants while many factories within the automotive and Reduction by
4%
other industries were at least partially shut down.
12 12Individual points of interest can be analyzed separately to gain
further insights. Example: IKEA Heerlen.
Total Trip Count: 14.333 Trips ending at IKEA: 8.697
Trips starting at IKEA: 5.636 Avg. Trip Distance: 26,6 km
Polygon Shape of shop
building and parking lot.
13
using INRIX data, 12th June 2020
13Individual points of interest can be analyzed separately to gain
further insights. Example: Catchment area of IKEA Heerlen.
• The graph: Locations of start points of trips which IKEA – Trip distance in m
had the end point at IKEA Heerlen. Start points of trips
min 29
with end points at
IKEA Heerlen P10.0 582
• The table: Percentile values of the trip distances to
P20.0 2300
IKEA Heerlen.
P30.0 4.075
• Following readings can be made: P40.0 6.264
P50.0 9.045
▪ “95 % of customers, who shop at IKEA P60.0 12.498
Herleen, come from within a radius of
P70.0 16.090
roughly 70 km or less”. This is a direct
P80.0 22.516
indication for the catchment area of the shop
(includes also logistic trips). P90.0 39.422
P95.0 70.082
▪ The majority of people who visit the shop from
P99.0 164.302
far locations come from the Netherlands.
r = ~70 km P99.9 207.180
max 259.328
using INRIX data, 12th June 2020
14Prior to lockdown measures
There was no severe impact of
COVID-19 on IKEA Heerlen.
2nd March to 8th March
• Upper graph: Breakdown of the trip count per day and hour to
IKEA Heerlen prior to the lockdown measure. High
• Lower graph: Breakdown of the trip count per day and hour to
IKEA Heerlen after the lockdown measures.
• The graphs suggest following readings:
After lockdown measures
▪ The peak hours of traffic to the IKEA Heerlen are on
Weekends between 10 am and 2 pm with the highest
amount of traffic on Saturdays. On weekdays the traffic is
nearly equally spread over the opening times with no clear
13th April to 19th April
pattern.
Low
▪ After the lockdown measures the traffic was slightly reduced
with the peak hours remaining the same.
15Vielen Dank! holger.hochguertel@inrix.com
You can also read