ESSE 4230-2020; Remote Sensing of the Atmosphere : Assignment 3 - some solutions
←
→
Page content transcription
If your browser does not render page correctly, please read the page content below
ESSE 4230-2020; Remote Sensing of the Atmosphere : Assignment 3 - some solutions
1) St John's had heavy snowfall on Jan 17, 2020. See https://www.macleans.ca/news/canada/the-
blizzard-that-buried-st-johns-photos-and-videos/, and many other sites.
12 hr snowfall at St. John's Airport (from METARS was 54 cm between 1200UTC on Jan 17 and
0000UTC on Jan 18). Check ECCC daily values at the airport (missing!) and other locations and
compare with the (historical) radar data (https://climate.weather.gc.ca/radar/index_e.html ) from
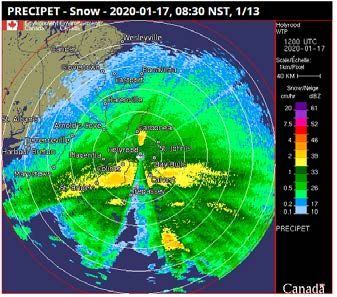
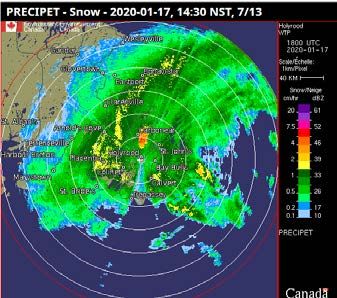
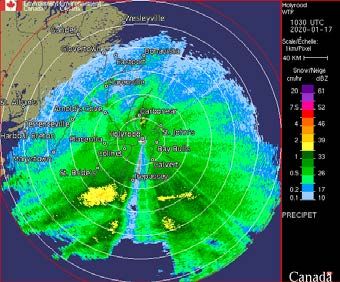
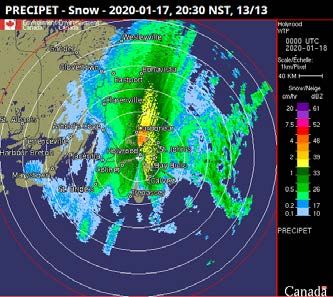
Holyrood for that period - earlier sample below but beware of shadow zone S of the radar site and
doubtful values due N of the radar - ground clutter. What stands out from the radar data?
Estimate an approximation to the total precipitation 12Z – 00Z in downtown St John's from the 10 min
radar images and compare the precipitation amounts with other sources of information.
----------------------------------
As background I now learn that for N of Holyrood "The side lobes illuminate the sea surface there and depending
on wind direction we can have quite a bit of sea clutter, which the Doppler filters do not reject. Sea clutter also
depends on ice conditions. In winter the sea clutter can go away if there is a protracted northeast wind and then
reappear after the wind blows from southwest." and "There is indeed a hill to the south. Some finer radials with
low reflectivity reflect a number of communication towers on the same hill top.”
By looping the radar imagery one can see a band of heavier precipitation track S to N between 12 and 15 UTC on
Jan 17, 2020 with continued moderate and light snowfall until around 12 Z on Jan 18. During the 12 hour period
12Z - 24Z on 17th, by reading off the historical radar imagery close to St John’s airport. My CYYT estimate from 10
min and 30 min Holyrood radar imagery Jan 17, 12Z-24Z has max 4 cm/hr but were mostly below 2 cm/hr and
closer to 1 cm/hr. My best estimate of the total accumulation at CYYT in that 12-hour period based on ECCC radar
is 17 cm, far less than the 54 cm from the METAR and newspaper reports. Half hour rates were 1, 1.5, 2, 3, 2, 2, 1,
1, 1.5, 1.5, 1, 1.5, 1.5, 1, 1, 1.5, 1, 1, 1, 1, 1, 1, 1, 2, adding to 34 cm/hr x 1/2 hr = 17 cm. Sample images below.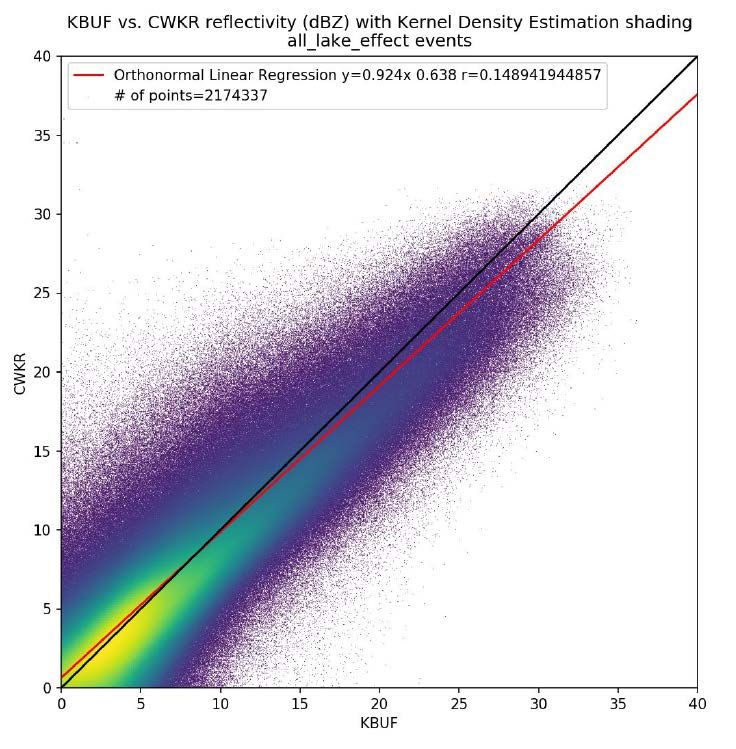
2) The ECCC announcement, https://www.canada.ca/en/environment-climate-
change/services/weather-general-tools-resources/radar-overview/modernizing-network.html
and the related contract
https://buyandsell.gc.ca/procurement-data/award-notice/PW-TOR-018-6873-001
describe the modernization of Canada's weather radar network.
a) The new S-band radars will operate at a longer wavelength and with more power than the
current C-band radars and will have dual polarization and Doppler capability. Explain the impacts of
the change in wavelength and power - advantages and any possible disadvantages. What are the
advantages of dual polarization?
b) On a day when it is raining or snowing, compare one hour’s worth of data (dBZ values from
plots) over the City of Toronto from the King City C-band radar
(https://weather.gc.ca/radar/index_e.html?id=WKR ) and from the US NWS Buffalo S-band radar at
https://radar.weather.gov/radar.php?rid=buf&product=N0R&overlay=11101111&loop=no
If you managed to do this in the rain, estimate the dBZ values over York and compare with the York
weather station measurements. If snow then compare with ECCC daily snowfall data for City Centre.
-----------------------------------------
a) Advantages are less attenuation with S-band, but less backscatter as well. More power and larger
dishes are used, but give longer range, or better signals at long
range. Note 40 km range rings and max range 250/256 km
Exeter is now S-band. The image to the right is for the same
time as the King/Buffalo comparison in part b. It gives better
coverage over Windsor than earlier C band radar. Problems
with higher power are more possible impacts on local residents
and lowest beams may be restricted, so that height at long range
may be above some precipitation. (250 * sin (1degree)) = 4.4
km, but Earth curvature and refraction will modify height above
ground at that range. Fabry spreadsheet from eA.1 gives 8.3 km.
Dual polarization provides additional parameters such as ZDR
and KDP which can refine precipitation estimates in rain and
improve characterization of the precipitation type,
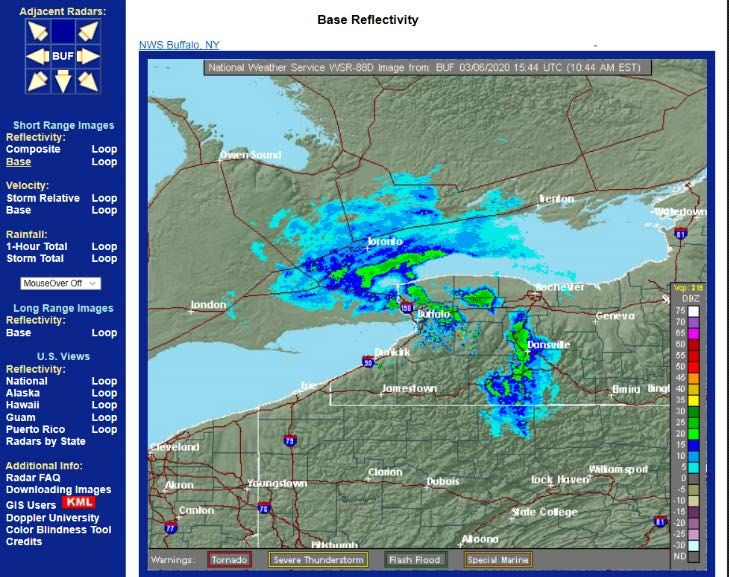
b) I did this King-Buffalo comparison on March 6, 2020 at about 1540 UTC, there was light snow and the
King radar display was on the "snow" setting.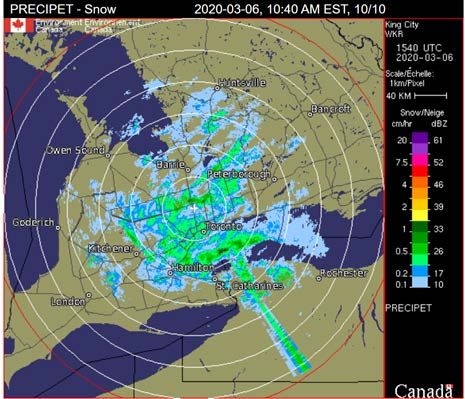
Reading off dBZ values from the King radar suggests values in the 10 to 26 dBZ range over the City of
Toronto while a maximum value of about 33-36 dBZ shows up S of Toronto over the Lake.
Corresponding values from the Buffalo radar are 10-15 dBZ over Toronto and a max of maybe 25 over the
lake.

BACKGROUND INFORMATION - not expected in student answers
Why are the King values higher? Brandon Taylor's MSc thesis shows generally good agreement between
dBZ values provided directly by the King radar group and provided to him by NWS, see the plot below.
Agreement wasn't always perfect but a 10 dB difference seems unlikely. Going back to the Historical
Radar imagery for King we can switch from Snow to rain images, see below.

With the "Rain " scaling, the values over Toronto show 7-23 dBZ and a max over the lake in the 28- 33
dBZ range. These are in better agreement with Buffalo so we assume that the ECCC "snow" version is
plotting dBZe + 6.5 dB while Buffalo is showing dBZe.

Note that I only realized this issue after the class has worked on this assignment so it will be interesting to
see whether, if their comparisons are with snow, they find similar KBUF, CWKR differences.

Daily precipitation values in and around Toronto on March 6 were 1.3mm (SWE) at City Centre, where
there was a mix of snow and rain through the day, 1.2mm at Toronto City, 2.2mm at North York and at
Pearson Airport, although there it was mostly snow, for about 6 hours.

Taking the snowfall rate from the King radar over Toronto as 0.2 to 0.5 cm/hr over 6 hours (from looping
the historical images) would give values consistent with those reported at the weather stations.

                                ----------------------------------------------------
You can also read