Q1 2021 | Office Market Report - Lee & Associates NYC
←
→
Page content transcription
If your browser does not render page correctly, please read the page content below
Q1 2021 | Office Market Report
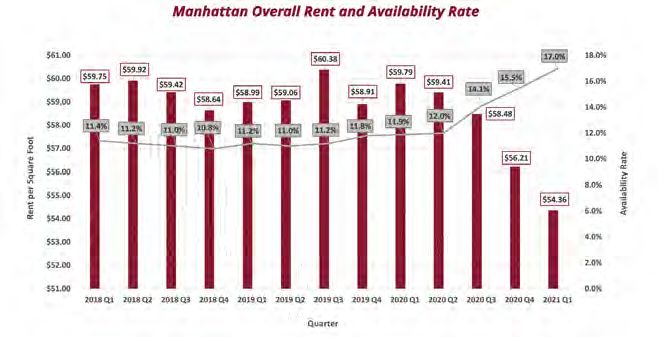
Manhattan Leasing Velocity Falls MANHATTAN OVERALL RENT & AVAILABILITY RATE
to Lowest Level of the Pandemic;
Market Fundamentals Continue
to Favor Tenants
As the one year anniversary of the COVID-19 pandemic’s
arrival in New York City passes, the Manhattan office leasing
market remains suppressed and skewed in favor of tenants.
Leasing velocity in Q1 2021 reached its lowest level of the
pandemic, with 4.3MM square feet (SF) of transactions, a 51%
y-o-y decrease from Q1 2020. The Manhattan availability
rate ticked up to 17%, a 150 basis point increase from the
previous quarter. Average overall taking rents fell 3.3% from MANHATTAN OVERALL LEASING VOLUME
Q4 2020 to $54.36.
A total of 582 leasing transactions were recorded during the
quarter, equating to an average deal size of 7,520 SF. While
the number of transactions has been increasing for the last
three quarters, from a low of 338 in Q2 2020, the average
deal size has been trending down from its pandemic-high of
14,524 SF in Q2 2020. In Q1 2021, 91% of leasing transactions
were under 15,000 SF. The persistently low leasing velocity
city-wide leads to the outsized influence from just a few large
transactions. Over 16% of the quarter’s leasing volume is due
to a single deal, Blackstone’s renewal/expansion for 720,000 2021 Q1 OVERALL AVAILABILITY RATE BY SUBMARKET
SF at 345 Park Avenue.
The Downtown submarket continues to be the sick man
of Manhattan, with only 473,000 SF of leasing transactions
during the quarter. Availability Downtown increased by 2.1
million SF since Q4 2020. The average Downtown taking
rent has decreased only 3.3% y-o-y, to $53.42, compared
to discounts of 9.75% in Midtown and 15.5% in Midtown
South during the same period. Downtown landlords may be
deciding to ride out the pandemic with elevated vacancies,
believing that dropping rents or increasing concessions will
not generate increased leasing demand in the short term.
845 THIRD AVENUE | FOURTH FLOOR | NEW YORK, NY 10022 | www.leeassociatesnyc.com
Lee & Associates analyzes statistics via our proprietary property database. All information contained in this publication, report and statistical variables are from sources deemed to be reliable. Lee & Associates accepts no
liability or responsibility for the accuracy or completeness of the information contained herein and no reliance should be placed on the information contained in this document.
Q1 2021 | Office Market Report
                                                                                                                                  New York’s Economic Recovery
                                                                                                                                        Remains on Hold
                                                                                                                             New York City’s unemployment rate remains elevated
                                                                                                                             compared to New York State (8.8%) and national rate
                                                                                                                             (6.3%). After holding steady at 12% during Q4 2020, the
                                                                                                                             unemployment rate in the city increased 90 basis points to
                                                                                                                             12.9% during Q1 2021. Offices buildings remain 15-20%
                                                                                                                             physically occupied, and Metro North and LIRR commuter
                                                                                                                             rail ridership remain down 70-80% from 2019 numbers,
                                                                                                                             showing virtually no improvement for eight months. A
                                                                                                                             survey released in February stated that 90% of restaurants
                                                                                                                             in New York did not pay full rent in December of 2020.
                                                                                                                             Tourism data is improving, with the city’s hotel occupancy
                                                                                                                             rate hitting 47% in mid-March, its highest point in over 10
                                                                                                                             months, but still a far cry from 87% occupancy during the
                                                                                                                             same period in March 2019. Any measurable recovery in
                                                                                                                             the city’s economic outlook will remain delayed so long as
                                                                                                                             millions of office employees work from home and tourists
                                                                                                                             stay away. COVID-19 vaccine uptake has been increasing
                                                                                                                             dramatically, with over 38% of New York State having
                                                                                                                             received at least one dose, so hopefully the light at the end
                                                                                                                             of the tunnel is approaching.

        Sublease Space Continues to Force
         Landlords to Compete on Pricing
 2.4 million SF of sublet space was added to the market in Q1,
 bringing the total sublet availability to nearly 23.9 million SF.
 General availability is highest in Soho, at 23.1%, followed by Grand
 Central and Chelsea, at 19.1% and 18.2%, respectively. Submarkets
 with high availability are not seeing the highest transaction volume,
 however. The Plaza District accounted for 32.9% of the leasing
 volume in Q1, as tenants seem to be attracted to quality over the
 cheapest deals. Average taking rents in the Plaza District continued
 their downward trend in Q1 2021, decreasing to $67.24, a 4.23%
 drop from Q4 2020. The flight to quality is perhaps the strongest
 visible trend in the market, with tenants motivated to pursue spaces
 that were once unaffordable. Landlord concession packages have
 increased over the past year, with free rent growing 17% to over 13
 months for 10-year deals, and tenant improvement allowances (TI)
 rising 15.5% to an average of $124 per SF. During Q1 2021, free
 rent packages as high as 24 months and $150 per SF in TI have
 been recorded for 15-year deals. Direct net effective rents are down
 18-20% on average from Q1 2020.

                                     845 THIRD AVENUE | FOURTH FLOOR | NEW YORK, NY 10022 | www.leeassociatesnyc.com
Lee & Associates analyzes statistics via our proprietary property database. All information contained in this publication, report and statistical variables are from sources deemed to be reliable. Lee & Associates accepts no
liability or responsibility for the accuracy or completeness of the information contained herein and no reliance should be placed on the information contained in this document.
Q1 2021 | Office Market Report
                                                                                       SUBLEASE SPACE AS SHARE OF OVERALL AVAILABILITY

                                                                                            2021 Q1 SUBLET, DIRECT & OVERALL AVAILABILITY

                                                                                               AVERAGE RENT BY SUBMARKET IN MANHATTAN

                                     845 THIRD AVENUE | FOURTH FLOOR | NEW YORK, NY 10022 | www.leeassociatesnyc.com
Lee & Associates analyzes statistics via our proprietary property database. All information contained in this publication, report and statistical variables are from sources deemed to be reliable. Lee & Associates accepts no
liability or responsibility for the accuracy or completeness of the information contained herein and no reliance should be placed on the information contained in this document.
Q1 2021 | Office Market Report
Top Leasing Transactions
MIDTOWN
Blackstone Mount Sinai Houlihan Lokey
345 Park Avenue 787 Eleventh Avenue 245 Park Avenue
Plaza District Columbus Circle Grand Central
Direct Renewal/Expansion Direct New Direct New
720,000 sf 167,348 sf 148,233 sf
MIDTOWN SOUTH
Suntory Group Freshly Diller Scofidio + Renfro
11 Madison Avenue 63 Madison Avenue 601 W 26th Street
Flatiron Flatiron Chelsea
Direct New Direct New Direct Renewal
99,566 sf 91,040 sf 21,716 sf
DOWNTOWN
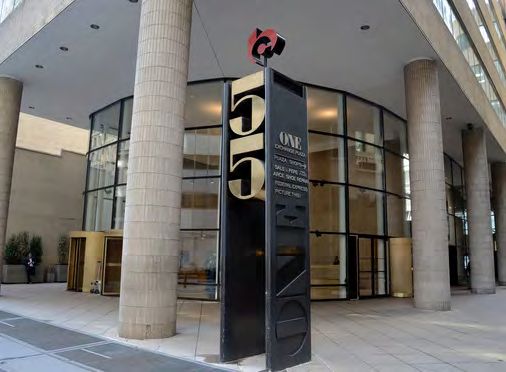
IPC Systems Public Health Solutions Consulate General of Morocco
1 State Street Plaza 40 Worth Street 55 Broadway
Financial District Tribeca World Trade Center
Direct Renewal Direct Renewal Direct New
26,652 sf 26,598 sf 18,294 sf
845 THIRD AVENUE | FOURTH FLOOR | NEW YORK, NY 10022 | www.leeassociatesnyc.com
Lee & Associates analyzes statistics via our proprietary property database. All information contained in this publication, report and statistical variables are from sources deemed to be reliable. Lee & Associates accepts no
liability or responsibility for the accuracy or completeness of the information contained herein and no reliance should be placed on the information contained in this document.

You can also read