A WALKING AND CYCLING BENCHMARKING TOOL - Tim Hughes Martin Wedderburn Tim Cheesebrough
←
→
Page content transcription
If your browser does not render page correctly, please read the page content below
A WALKING AND CYCLING
BENCHMARKING TOOL

        Tim Hughes          NZ Transport Agency
        Martin Wedderburn   Colin Buchanan and Partners
        Tim Cheesebrough    MWH New Zealand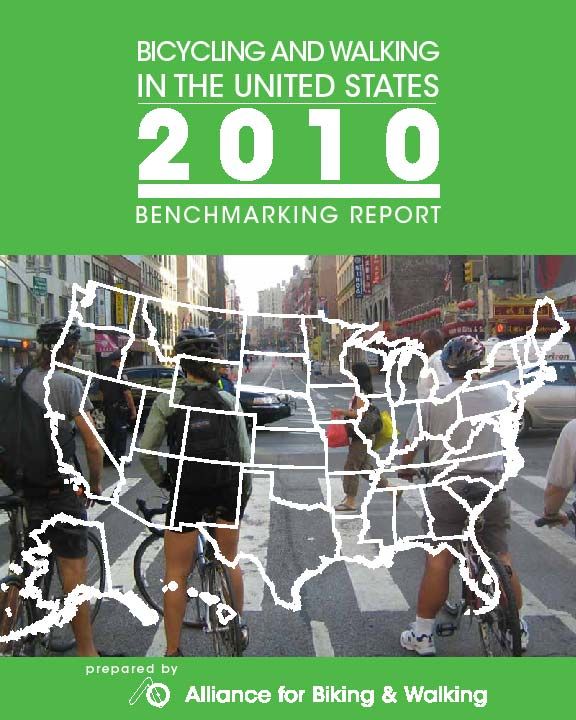
A New Walking and Cycling Benchmarking Tool for NZ
Background to development of the tool
International benchmarking examples studied by MWH NZ and Colin Buchanan
and Partners (UK)
Principles of the tool required for New Zealand
Adapting the European Foundation for Quality Management Model
An assessment matrix methodology
How the new tool might be used across NZ
Update on current status of the project
Upcoming regional stakeholder workshops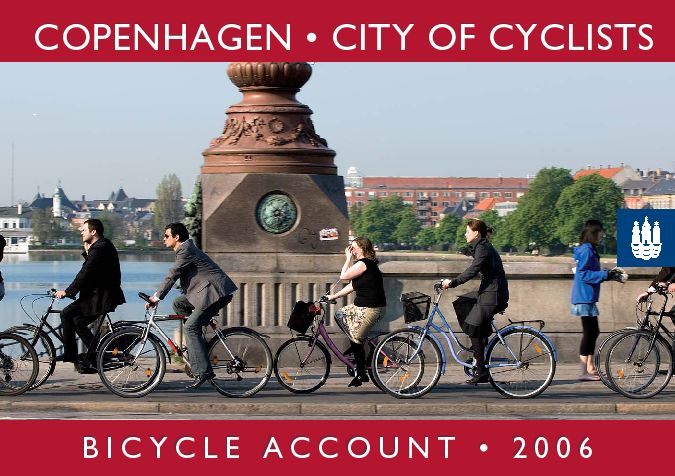
What is Benchmarking?
Benchmarking of local authority cycling
and walking practice was seen as a key
enabler of best practice in support of NZ
Walking and Cycling Strategy
Chief purpose ‐ to help all local
authorities to improve services across a
range of activities that support cycling and
walking
Most important objective is to help
identify and share best practice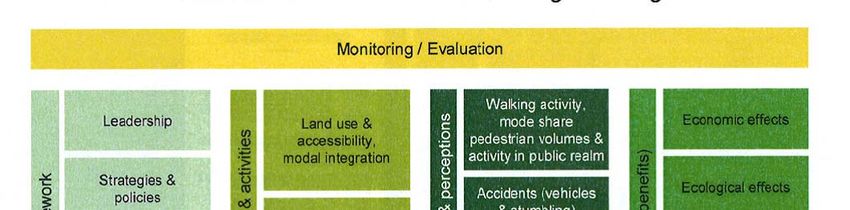
Benchmarking Principles…
Uses performance measurement of an
authority’s:
institutional framework and resources (the
enablers)
its resulting activities
cycling and walking outcomes
ultimate “impacts” – such as social, environmental,
economic, quality of life effects from active travel
support
…as a common yardstick to identify and
compare best practice – both nationally and
internationally
Benchmarking Principles… Not intended to create performance “league tables”, except where of help to authorities seeking to maximise their own value for money and delivery When working well, identifies genuinely adaptable best practice in a supportive environment, with the help of NZTA and a peer group of like minded authorities
How Does Successful Benchmarking
Work?
The Process
Self Analysis
Identifying best practices that might be adaptable
Analysing performance and delivery differences across
authorities
Implementing findings locally to improve effectiveness and
value for money of authority’s approaches
The Results
Narrowed performance gaps across sector
Tangible performance improvements and improved value for
money for each contributing authority
International Examples Studied
   A large number of completed and ongoing benchmarking processes used
   around the globe studied, including :

Velo Info
European Bicycle Policy Audit (BYPAD)
English Regions Cycling Development Team (ERCDT) (UK)
CTC (Cyclists Touring Club) Local Authority Benchmarking Project (UK)
Dutch Cycle Balance
Bicycle Federation of Australia
Copenhagen Bicycle Account
US Alliance for Biking and Walking (formerly the Thunderhead Alliance)
Walk 21 Dimensions / Comparators
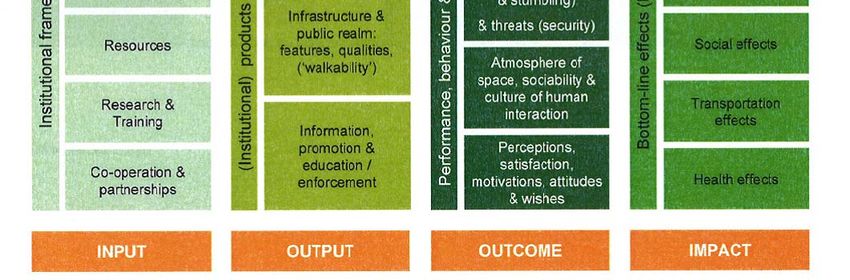
Comparing the approaches…

        Direction of travel for benchmarking practices - in
        monitoring output, outcome and impact performance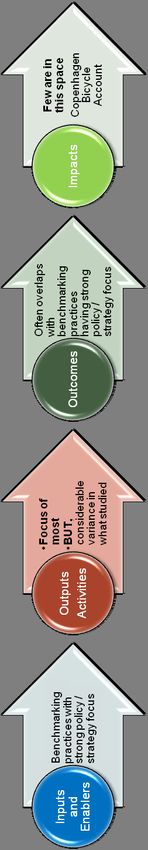
A base Model for Business Excellence

                       Enablers                                            Results

                                                                                       Ke y Pe r f or m an ce
                           Pe op le                              Pe op le Re sult s
    Le ad e r sh ip

                                                  Pr oce sse s

                                                                                             Re sult s
                        Policy an d                                 Cust o m e r
                         St r at e g y                               Re sult s

                       Par t n e r sh ip s
                                                                 Socie t y Re sult s
                      an d Re sour ce s

                                             Innovation and Learning

European Foundation for Quality Management (EFQM) Model
International objective
“Establishing a set of international guidelines for the
collection, analysis and dissemination of quantitative
and qualitative techniques for measuring walking.”

(WALK21 conference conclusions Melbourne 2006)
International Walk 21 conference workshops Website: www.measuring‐walking.org/ Walking benchmarking assessment model Making Walking Count resident surveys
USA Alliance for Biking and
Walking
Levels of walking /
cycling
Safety
Funding
Education
Advocacy
Public healthUSA Alliance for Biking and Walking
Copenhagen Bicycle Account
Copenhagen Bicycle Account
Cycle flows
Infrastructure
Satisfaction
Safety
Funding
Health
Perceptions of other road
usersMaking Walking Count
1. Walking activity
2. Activity in the public realm
3. Local accessibility
4. Motivations
5. Barriers
6. Perception of the walking
environment
7. Measures to improve the
walking environment
8. Transport spending
prioritiesTime spent walking
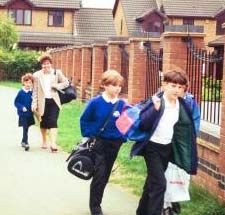
Children walk to primary school
unaccompanied?
Time spent in public space
Measuring Walking Project (Walk 21)
New 2010 Assessment Model for Measuring Walking

   Courtesy of Urban Mobility Research, Switzerland (Daniel Sauter)
Latest 2010 Cycling Model Adaptation
(to closely accord with new Walk 21 model)
A two stage benchmarking process for NZ…
Stage A - Self Assessment
Collection of primarily quantitative / factual
information
Maximum use of existing data sets – eg LTCCP
published programmes, performance results –
alignment to MoT TMIF(2)
Authority determines for itself where it currently
stands
Stage B - Peer Group Independent
Assessments
Facilitated visits by and to peer group
authorities
Focus on qualitative assessment:
common success factors, sharing experience,
finding adaptable best practice - policy and
strategy into practicePlease contact us: Tim Hughes NZ Transport Agency (Christchurch) tim.hughes@nzta.govt.nz Martin Wedderburn, Colin Buchanan (UK) martin.wedderburn@cbuchanan.co.uk Tim Cheesebrough MWH NZ tim.l.cheesebrough@nz.mwhglobal.com
You can also read