Reply to Anonymous Referee #1 review of manuscript acp-2021-456
←
→
Page content transcription
If your browser does not render page correctly, please read the page content below
Reply to Anonymous Referee #1 review of manuscript acp-2021-456

Impact of COVID-19 pandemic related to lockdown measures on tropospheric NO2
columns over Île-de-France
Andrea Pazmino on behalf of all co-authors

We warmly thank Anonymous Referee #1 for the interest that he showed in our work and for the time
spent on its evaluation. Your valuable comments have helped us to improve our manuscript. Please
find our answers to your comments (in red)

This study addresses the influence of physical distancing, due to the COVID-19 pandemic, in NO2
concentration over Île-de-France. The manuscript has very interesting results and performs a good
comparison with similar studies.

Main questions

Line 117: Please, detail or add some reference about this quality assurance.
Recently Verhoelst et al., 2021 validated total, stratospheric and tropospheric columns of NO2 of
TROPOMI against consolidated ground-based data. In the case of tropospheric NO2, the TROPOMI’s
quality assurance value (QA) higher than 0.75 is used to remove cloudy scenes presenting cloud
radiance fraction higher than 0.5, snow- or ice-covered scenes, and problems in the retrieval. In our
study, we have decided to use a less restrictive threshold of 0.5 to enhance the number of days taken
into account and not to bias the results to clear day conditions. In order to evaluate the impact on
SAOZ and TROPOMI comparison using a less restrictive QA, the monthly mean tropospheric NO2
above Paris of TROPOMI was computed considering only data with QA>0.75 (Figure 1, bottom
panel) and results of QA> 0.5 of the paper were included in the upper part of the figure. Only SAOZ
coincident days with TROPOMI are taken into account to compute the monthly mean.

Figure 1: Left panels: Monthly mean tropospheric NO2 and 2σ standard error above Paris measured by ground-
based SAOZ instrument (red lines) and TROPOMI satellite instrument (black lines) with QA>0.5 (upper panel)
and QA>0.75 (bottom panel). Right panels: Histogram of TROPOMI-SAOZ differences for TROPOMI QA >0.5
(upper panel) and QA>0.75 (bottom panel). Vertical lines represent the median, mean and dispersion by the half
of the 68% interpercentile (IP68/2).

                                                      1
A similar evolution of tropospheric NO2 is observed using QA>0.5 or 0.75. Approximately twice as
much TROPOMI data is considered for QA>0.5 than QA>0.75. The median value of the difference is
of the same order of magnitude and the dispersion is slightly higher for QA>0.5.
The comparison of the two TROPOMI datasets is presented in Figure 2. The monthly mean values
present similar seasonal evolution within 2σ except on December 2020 where only one value is
observed for QA>0.75.
Figure 2: Monthly mean tropospheric NO2 and 2σ standard error above Paris measured by TROPOMI satellite
instrument with QA>0.5 (black lines) and QA>0.75 (blue lines)
As a conclusion of this discussion, we decided to keep the TROPOMI data with a QA above 0.5 for
this study.
The following paragraph was removed at the end of Section 2.1.2.
“The data have been filtered using the quality assurance value higher than 0.5.”
and replaced by
In his validation paper against consolidated ground-based data, Verhoelst et al., 2021 was
using TROPOMI's tropospheric columns of NO2 with a quality assurance value (QA) higher than 0.75
to remove cloudy scenes presenting cloud radiance fraction higher than 0.5, snow- or ice-covered
scenes, and problems in the retrieval. In our study, we have decided to use a less restrictive threshold
of 0.5 in order to enhance the number of days and to avoid biasing the results towards clear day
conditions. This resulted in doubling the number of data taken into account. The monthly mean NO2
tropospheric columns of TROPOMI present similar seasonal evolution within 2σ for both QA (not
shown).
Is there some previous validation of ERA-5 data over Île-de-France?
ERA 5 surface wind over Europe have been validated with wind observations from 245 stations in
Europe, including two stations in Ile de France (Molina et al., 2021). The conclusion is that ERA5 is
able to reproduce the wind speed from hourly to monthly time frequencies for any location in Europe
with a Pearson's correlation coefficient varying from 0.6 to 0.85 in hourly scale and 0.9 to 0.95 in 24-
hourly scale.
Reference
Molina, M. O., Gutiérrez, C., and Sánchez, E.: Comparison of ERA5 surface wind speed climatologies over
Europe with observations from the HadISD dataset, Int. J. Climatol., 1–15, joc.7103,
https://doi.org/10.1002/joc.7103, 2021.
2The following phrase and the corresponding reference was introduced in L142 of the paper
ERA 5 surface wind over Europe have been validated with wind observations from 245 stations in
Europe, including two stations in Ile de France (Molina et al., 2021). The conclusion is that ERA5 is
able to reproduce the wind speed from hourly to monthly time frequencies for any location in Europe
with a Pearson's correlation coefficient varying from 0.6 to 0.85 in hourly scale and 0.9 to 0.95 in 24-
hourly scale.
Is it possible to add information about the variation of physical distancing rate observed during the
four stages (P1, P2, P3, and P4)? Such information can help the discussion presented in sections 4.1
and 4.2.
The following phrase was added in L203 as well as the Table
“Table 2 shows different periods in 2020 related to restrictions imposed by French government to limit
COVID19 propagation.
Table 2. The four periods in 2020 shown in Figure 3 and the related restrictions imposed by the French
government to limit the COVID19 propagation.
Periods in 2020 Restrictions
P1 1 Jan to 16 March Not any
P2 17 March to 10 May 1st lockdown: non-essential stores, schools, cultural establishments, etc
closed. Only displacementsAs explained before, only P2 restrictive lockdown period was considered and the mid-altitude of
convective BL is appropriate within this period. This choice only affects the height level for which the
wind data are taken from meteorological analysis. This height level needs to be located somewhere
within the convective boundary layer. In Figure 3 (Figure 3.5 of Dieudonné, 2012), the time series of
daily maximum BL height between July 2009 and February 2011 calculated from Rayleigh lidar
measurements at Qualair station in Paris, co-located to the SAOZ instrument are shown. The BL
values were selected considering only clear (red points) and cloudy sky days. The black line
corresponds to the rolling 30-day average. The figure shows clearly the variation of the BL over Paris
as a function of season. These measurements are only available for a limited period in 2009-2011.
They confirm the variation of the boundary layer as a function of season between 1.5 and 2.5 km, our
choice seems appropriate. Within the convective boundary layer, wind variations are smaller than for
example close to the surface. Choosing the height level at the exact middle of the boundary layer
would much complicate the analysis and make results less transparent than choosing a fixed height
level.
Figure 3. Time series of daily maximum Boundary layer height observed by the lidar of the Qualair station in
Paris, with clear / cloudy days in red / blue. The black line represents the rolling 30-day average (Dieudonné,
2012).
Reference
Elsa Dieudonné. Analyse multi-instrumentale de l’influence de la variabilité de la hauteur de couche limite sur la
distribution verticale des oxydes d’azote en région parisienne. Physique Atmosphérique et Océanique
[physics.ao-ph]. Université Pierre et Marie Curie - Paris VI, 2012. Français. tel-00807665
Technical questions
Figure 2: Please, add the units in the legend.
The figure 2 was changed as follows:
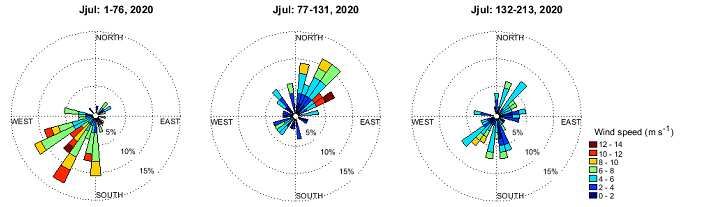
4Figure 2: From left to the right: wind rose from 12 UT ERA5 data before (1/1-16/3), during (18/3-10/5) and
after (11/5-31/7) the 1st lockdown in France in 2020. The color indicates the wind speed in m s-1. The
frequency in % is showed by the circles.
Line 228: "11 and 14 UT"
Done
Figure 4: Please, use the same labels in the x-axis of the upper and lower panel.
Done
Line 248: "11 and 14 UT"
Done
5You can also read