STATE OF THE MARKET - Renewable Energy Buyers Alliance
←
→
Page content transcription
If your browser does not render page correctly, please read the page content below

STATE OF THE MARKET

Thank you to the Supporters of REBA and the Sponsors
     of REBA Connect: Virtual Member Summit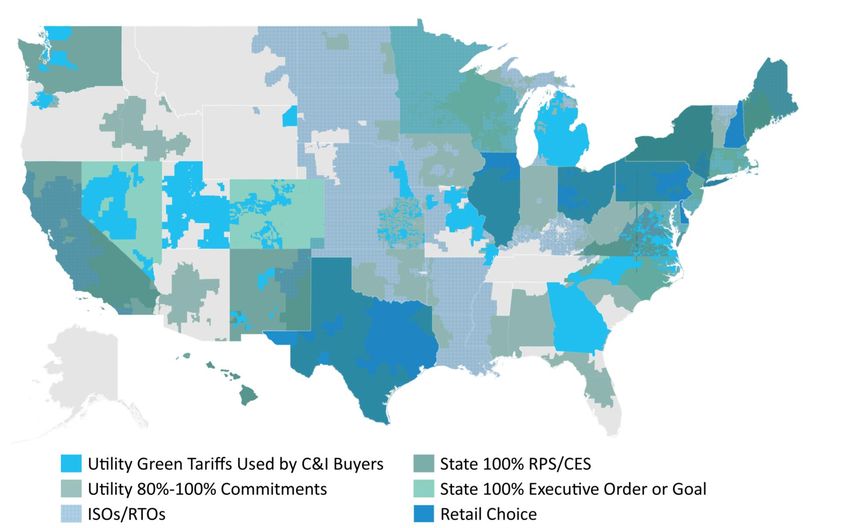
Thank you to all our REBA members!
REBA Leadership Circle           Platinum Members
                                    AT&T Microsoft
                                  QTS Target VMware

                                     Gold Members
                                 Adobe               Micron Technology
                         Anheuser-Busch InBev              Nestle
                                Atlassian                   Nike
                                Autodesk                   PayPal
                               Bloomberg                  PepsiCo
                                  Cargill              Starbucks Corp
                                  Cisco                VF Corporation
                              Cummins Inc.           174 Power Global
                                   eBay         Bank of America Merrill Lynch
                                 Equinix          Covington & Burling LLP
                          Freeport-McMoRan       CustomerFirst Renewables
                                   IBM          Morgan Stanley Capital Group
                             Iron Mountain                 Orsted
                          McDonald's USA, LLC          Wilson Sonsini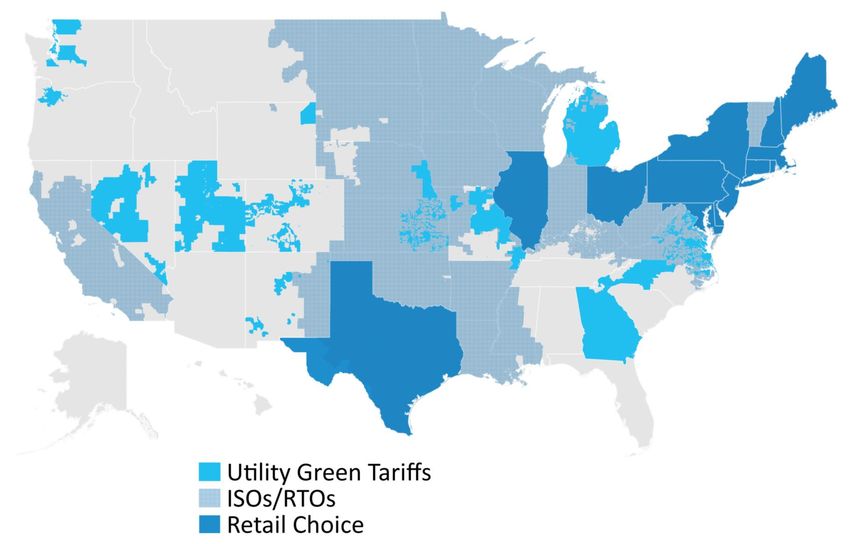
Acknowledgements

    Authors             Third Party Data Sources
    Bryn Baker                         CDP
Miranda Ballentine    Electric Reliability Council of Texas
   Priya Barua        Energy Information Administration
 Katherine Kerr          National Renewable Energy
  Camorah King                     Laboratory
   Alex Klonick                      RE100
   Mark Porter               Science Based Targets
 Laura Vendetta                    S&P Global

                                                              4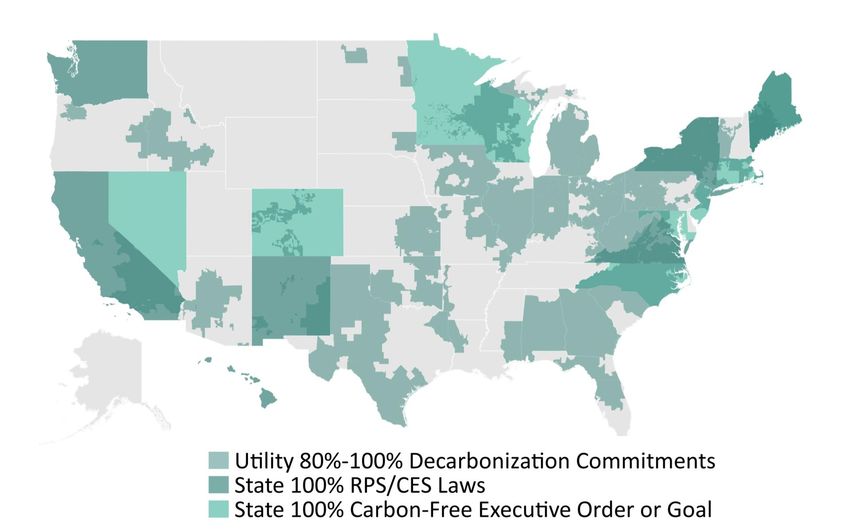
Agenda

The Buyers Journey

US Market Overview and Key Trends

Unlocking Future Procurement Options

Leadership Trends

                                       5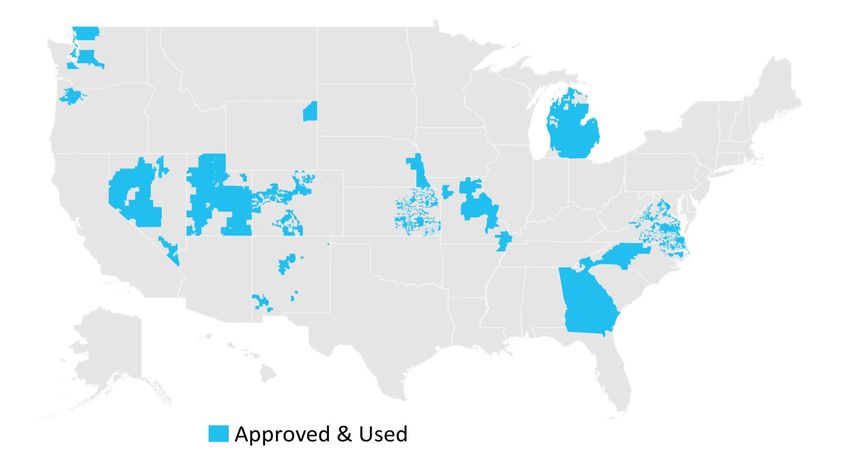
Agenda

The Buyers Journey

US Market Overview and Key Trends

Unlocking Future Procurement Options

Leadership Trends

                                       6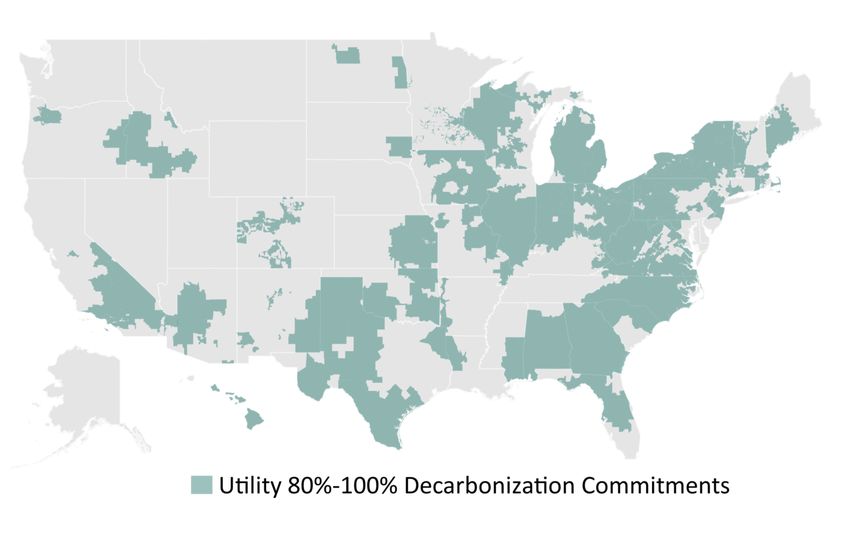
The Buyers Journey
                          From planning to action

                                                    ACTION
                                                    • Pursuing goals with
                           COMMITMENT                 RECs, PPAs, project
                           • Setting carbon           ownership and more
TRANSPARENCY                 reduction targets      • Restarting the process
• Accounting for your      • Pledging to clean        for supply chain, 24/7
  carbon footprint           energy goals             renewables, etc.
• Mapping your energy
  consumption

                            FEEDBACK LOOP

                                                                          7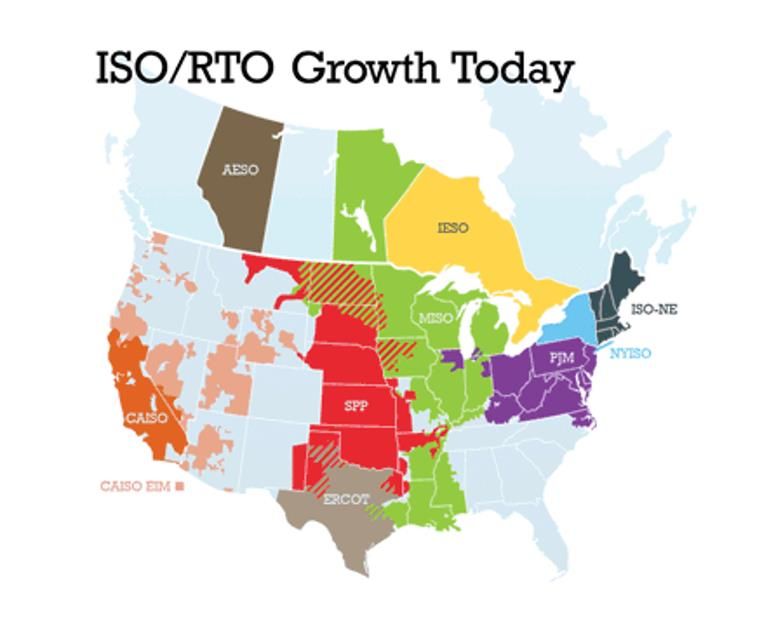
The Buyers Journey
                          From planning to action

                                                    ACTION
                           COMMITMENT
TRANSPARENCY
• Accounting for your
  carbon footprint
• Mapping your energy
  consumption

                            FEEDBACK LOOP

                                                             8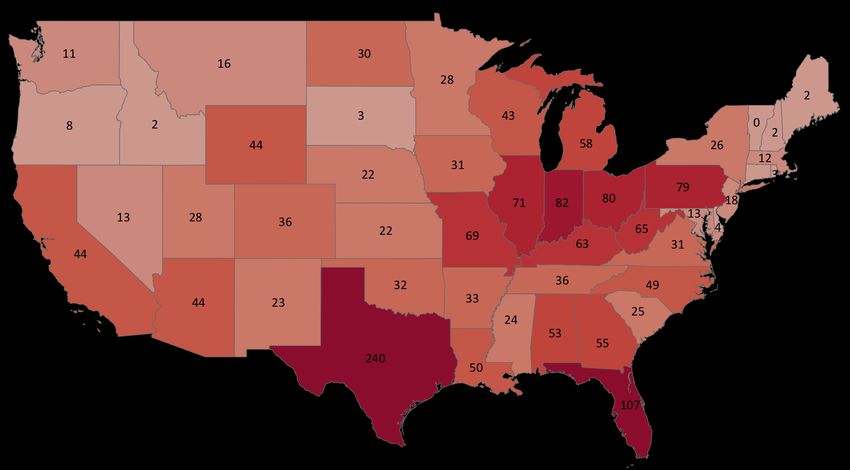
The Buyers Journey – Transparency
                                            Reporting is a key first step to managing a path forward

                                           9,000
                                                             Companies disclosing to CDP
                                  to CDP
                              to CDP       8,000

                                           7,000
                   Disclosing

                                           6,000
         Companies Disclosing

                                           5,000
      Companies

                                           4,000

                                           3,000
   Total

                                           2,000
Total

                                           1,000
                                              0
                                                   2005 2006 2007 2008 2009 2010 2011 2012 2013 2014 2015 2016 2017 2018 2019
                                                         Source: https://www.cdp.net/en/companies/companies-scores
                                                                                                                                9
The Buyers Journey
                 From planning to action

                                           ACTION
                  COMMITMENT
                  • Setting carbon
TRANSPARENCY        reduction targets
                  • Pledging to clean
                    energy goals

                   FEEDBACK LOOP

                                                    10
The Buyers Journey – Commitments
Increases in goal setting with both an emissions and energy focus
Science Based Targets Companies RE100 Companies
400 70
800
60
RE100 Companies
200
SBT Companies
RE100Companies
Companies
300
Total RE100 Companies
50
Companies
Companies
Companies
600
150
40
200
SBTSBT
400
RE100
SBT
30 100
TotalTotal
New
New New
New
20
Total
100 200 50
10
0 0 0 0
2015 2016 2017 2018 2019 2020 YTD 2014 2015 2016 2017 2018 2019 2020 YTD
Source: https://sciencebasedtargets.org/companies-taking-action/# Source: http://there100.org/companies
11The Buyers Journey
From planning to action
ACTION
• Pursuing goals with
COMMITMENT RECs, PPAs, project
ownership and more
TRANSPARENCY • Restarting the process
for supply chain, 24/7
renewables, etc.
FEEDBACK LOOP
12The Buyers Journey – Action
Consistent growth in voluntary market sales
NREL Voluntary Green Power Sales
Total Green Power Sales (MWh)
Source: https://www.nrel.gov/docs/fy20osti/74862.pdf
13Agenda
The Buyers Journey
US Market Overview and Key Trends
Unlocking Future Procurement Options
Leadership Trends
14Announced Corporate Renewable Deals in the U.S.
10.0 9.33
8.0
6.39
GW of Capacity
6.0
4.0
3.22
2.76
2.0 1.54 1.76
1.20
0.0
2014 2015 2016 2017 2018 2019 2020
Over 26GW announced in the last 10 years
A s of A pril 24, 2020. Publicly announced contracted capacity of corporate P ower P urchase Agreements, Green P ower P urchases, G reen Tariffs, and Outright P roject Ownership in the US, 2015-2020 by quarter. Excludes on-site generation (e.g., rooftop
solar P V ) and deals with operating plants. (#) indicates number of deals each year by individual companies. Copyright 2020 Re newable E nergy Buyers Alliance. P roduced in part using data from S &P G lobal Market Intelligence, Copyright © 2020.
15Announced Corporate Renewable Deals in the U.S. by Quarter
GW of Capacity
Over 15GW announced in the last 2 calendar years
A s of A pril 24, 2020. Publicly announced contracted capacity of corporate P ower P urchase Agreements, Green P ower P urchases, G reen Tariffs, and Outright P roject Ownership in the US, 2015-2020 by quarter. Excludes on-site generation (e.g., rooftop
solar P V ) and deals with operating plants. (#) indicates number of deals each year by individual companies. Copyright 2020 Re newable E nergy Buyers Alliance. P roduced in part using data from S &P G lobal Market Intelligence, Copyright © 2020.
16Announced Corporate Renewable Deals in the U.S. by Quarter
GW of Capacity
Q1 2020 is down for a few reasons
A s of A pril 24, 2020. Publicly announced contracted capacity of corporate P ower P urchase Agreements, Green P ower P urchases, G reen Tariffs, and Outright P roject Ownership in the US, 2015-2020 by quarter. Excludes on-site generation (e.g., rooftop
solar P V ) and deals with operating plants. (#) indicates number of deals each year by individual companies. Copyright 2020 Re newable E nergy Buyers Alliance. P roduced in part using data from S &P G lobal Market Intelligence, Copyright © 2020.
172019 Announced Corporate Renewable Deals in the U.S. by Week
GW of Capacity
~3 GWs announced within 8 days in September
A s of A pril 24, 2020. Publicly announced contracted capacity of corporate P ower P urchase Agreements, Green P ower P urchases, G reen Tariffs, and Outright P roject Ownership in the US, 2015-2020 by quarter. Excludes on-site generation (e.g., rooftop
solar P V ) and deals with operating plants. (#) indicates number of deals each year by individual companies. Copyright 2020 Re newable E nergy Buyers Alliance. P roduced in part using data from S &P G lobal Market Intelligence, Copyright © 2020.
18Announced Corporate Renewable Deals in the U.S. by Quarter
GW of Capacity
Q2 2020 to date has already surpassed Q2 2018
A s of A pril 24, 2020. Publicly announced contracted capacity of corporate P ower P urchase Agreements, Green P ower P urchases, G reen Tariffs, and Outright P roject Ownership in the US, 2015-2020 by quarter. Excludes on-site generation (e.g., rooftop
solar P V ) and deals with operating plants. (#) indicates number of deals each year by individual companies. Copyright 2020 Re newable E nergy Buyers Alliance. P roduced in part using data from S &P G lobal Market Intelligence, Copyright © 2020.
19Market Expansion: New Buyers
Cumulative Unique Buyers
New Buyers
Over 100 companies have transacted in utility-scale renewable energy market since 2008
A s of A pril 24, 2020. Publicly announced contracted capacity of corporate P ower P urchase Agreements, Green P ower P urchases, G reen Tariffs, and Outright P roject Ownership in the US, 2015-2020 by quarter. Excludes on-site generation (e.g., rooftop
solar P V ) and deals with operating plants. (#) indicates number of deals each year by individual companies. Copyright 2020 Re newable E nergy Buyers Alliance. P roduced in part using data from S &P G lobal Market Intelligence, Copyright © 2020.
20Market Expansion: New Energy Providers
Cumulative Unique Energy Providers
New Energy Providers
A s of A pril 24, 2020. Publicly announced contracted capacity of corporate P ower P urchase Agreements, Green P ower P urchases, G reen Tariffs, and Outright P roject Ownership in the US, 2015-2020 by quarter. Excludes on-site generation (e.g., rooftop
solar P V ) and deals with operating plants. (#) indicates number of deals each year by individual companies. Copyright 2020 Re newable E nergy Buyers Alliance. P roduced in part using data from S &P G lobal Market Intelligence, Copyright © 2020.
21Increase In Unknown Deal Counterparties
10.0 9.33
8.0
6.39
GW of Capacity
6.0
4.0
3.22
2.76
2.17
2.0 1.54
1.20
0.0
2014 2015 2016 2017 2018 2019
In 2019, 2+ GWs from ~12 announced deals did not make energy provider public
A s of A pril 24, 2020. Publicly announced contracted capacity of corporate P ower P urchase Agreements, Green P ower P urchases, G reen Tariffs, and Outright P roject Ownership in the US, 2015-2020 by quarter. Excludes on-site generation (e.g., rooftop
solar P V ) and deals with operating plants. (#) indicates number of deals each year by individual companies. Copyright 2020 Re newable E nergy Buyers Alliance. P roduced in part using data from S &P G lobal Market Intelligence, Copyright © 2020.
22Technology Evolution
* This does not include ~800 MWs of deals in which the technology is not known
GW of Capacity
Solar
Wind
At least 2.5 GW of ~5 GW of solar announced in 2019 was in ERCOT
A s of A pril 24, 2020. Publicly announced contracted capacity of corporate P ower P urchase Agreements, Green P ower P urchases, G reen Tariffs, and Outright P roject Ownership in the US, 2015-2020 by quarter. Excludes on-site generation (e.g., rooftop
solar P V ) and deals with operating plants. (#) indicates number of deals each year by individual companies. Copyright 2020 Re newable E nergy Buyers Alliance. P roduced in part using data from S &P G lobal Market Intelligence, Copyright © 2020.
23Where are Corporates Signing Deals? – Until 2020YTD
Count of deals
1 25+
24CO2 Emission Factors From Electric Power
Emissions factor (metric tons/MWh)
0.01 0.95
Source: 2017 Total Electric Industry Power Data – EIA.com
25CO2 Emissions From Electric Power
Source: 2017 Total Electric Industry Power Data – EIA.com
26Battery Capacity in the ERCOT Interconnection Queue
Now Exceeds Gas Capacity
100%
2,847 3,012 Numbers on
3,265 3,501
4,121 3,957 3,971
4,200
bars represent
4,453 MWs of each
5,628
75% 7,215
tech category
7,790 8,965 9,978 10,380
Battery
50% Gas
10,825 10,529 10,537 10,103 9,740
9,737 9,283
8,207
7,405
7,445
25% 5,898 5,607 5,607 5,507 5,749
0%
Jan Feb Mar Apr May Jun Jul Aug Sep Oct Nov Dec Jan Feb Mar
Source: http://mis.ercot.com/misapp/GetReports.do?reportTypeId=15933&reportTitle=GIS%20Report&showHTMLView=&mimicKey
27Agenda
The Buyers Journey
US Market Overview and Key Trends
Unlocking Future Procurement Options
Leadership Trends
28Pathway 1: Greening the Grid for All
States Driving Decarbonization
29Pathway 1: Greening the Grid for All
Utilities Setting Decarbonization Commitments
30Pathway 1: Where is the Grid Greening for All?
31Pathway 2: Increase and Improve Customer Options
RTO Expansion
Source: isorto.org
32Pathway 2: Increase and Improve Customer Options
States with Green Tariffs Approved and Used
17 states have green tariffs available, 14 have active C&I customers
Data from REBA Green Tariff tracking and only includes deals that involve build of new generation and corporate commitments
33Pathway 2: Increase and Improve Customer Options
Utility Territories with Approved Green Tariffs Used by Corporates
Narrowing deployed green tariffs to utility service territories further highlights their limited availability
Data from REBA Green Tariff tracking and only includes deals that involve build of new generation and corporate commitments
34Pathway 2: Increase and Improve Customer Options
Where do customers have options?
35Bringing It All Together...
36Bringing It All Together...
42%
8% 29%
28% 2%
22% 33%
% of Electricity
52% 10% Consumption that is
Renewable
4%
17%
Based on EIA 2017 data
4%
37Agenda
The Buyers Journey
US Market Overview and Key Trends
Unlocking Future Procurement Options
Leadership Trends
38Trends Where Large Energy Consumers Want to Lead
1 2
Transitioning from 100% RE goals New/Additional Material Impact
to Projects Projects
24-7/365 zero carbon
source: Google source: WattTime
3 4 5 6
Policy & Regulatory More International Focus on Supply Impact Beyond
Engagement Procurement Chain Partners Carbon
39Thank you!
40You can also read