Using flight data to build a High-Frequency global Passenger Capacity Index - MARCH 9-11, 2021 Niall O'Hanlon, Alessandra Sozzi STA Department
←
→
Page content transcription
If your browser does not render page correctly, please read the page content below

Using flight data to
                                                 build a High-
                                                 Frequency global
                                                 Passenger Capacity
                                                 Index
                                                 MARCH 9-11, 2021
                                                 Niall O'Hanlon, Alessandra Sozzi
                                                 STA Department
Office| Statistics
IMF     for National Statistics (ONS), Newport                                      1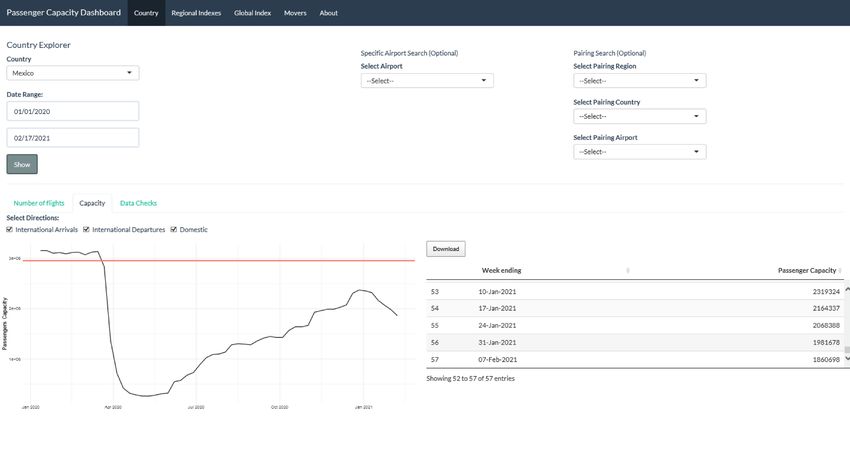
The economic impact of COVID-19
                   on tourism
                   •    Many countries have taken strong containment
                        measures, such as border closures and lockdowns, to
                        “flatten the curve” of infection.

                   •    International arrivals declined by 74% in 2020, translating to
                        a loss of USD 1.3 trillion in export revenues (UNWTO).

                   •    Economies of tourism-dependent countries have been hit
                        harder

                   •    Policymakers face daunting challenges in assessing of the
                        economic impact of travel restrictions
                       • Countries moving at different speeds between higher and
                          lower levels of restrictions on travel
                       • Timely official data related to travel in short supply
                       • For tourism-dependent economies, it also hampers the
                          ability to catch turning points in the recovery.
IMF | Statistics                                                                         2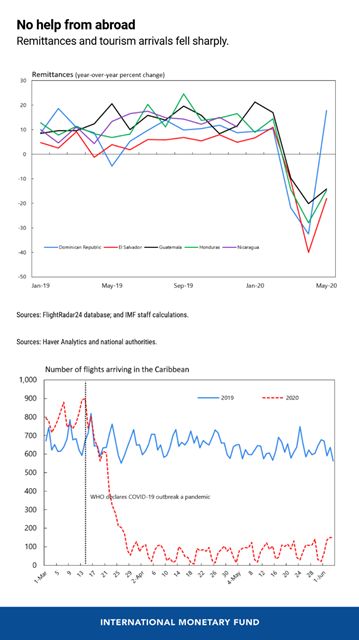
High frequency indicators to monitor economic
                   impacts
                   Very early in the pandemic colleagues began to use flight data to track the number of
                   flights to help better understand impacts on tourism revenues.

                   Our enhancements to the use of flight data:
                   • Exclude non-passenger flights (cargo, private, hobby, business flights, etc)
                   • Account for the differing capacities of flights
                   • Distinguish between domestic and international flights
                   • Present data in index form in addition to absolute numbers for ease of analysis
                   • Create national, regional, and global aggregations
                   • Develop a dashboard to allow internal users to easily develop customized queries
                     including tabulation

IMF | Statistics                                                                                           3
Commercial passenger flights
Flightradar24 is a global flight tracking service that provides real-time information about
flights around the world. (All flights type)
To identify Commercial passenger flights, for every flight we matched information on the
airport of departure and arrival, airline operator and aircraft against several sources
publicly available.
All airports with scheduled commercial traffic air service.
Airlines Passenger airlines sourced from public lists and manual refinements
Characteristics of planes collected
Aircrafts from several databases.
These include max altitude, length,
number of seats.
IMF | Statistics 4Passenger Capacity Index
Passenger Capacity Index
Passenger Capacity is estimated from the number of seats information as included in
the aircraft characteristics. (if a range for different combinations of seat classes, this is
estimated from the geometric mean)
We aggregate estimates at different granularities:
• Global and Regional Indices
• Country series
• Airport pairings series
IMF | Statistics 5Comparisons to Tourism Arrivals data
Mix of results:
Source: CEIC Data Company Limited, FlightRadar24, IMF Staff Calculations
For several countries the series are very close, with almost perfect correlation
• Lack of official data is an issue, especially for more recent comparisons. Series had to be
compared monthly.
• Estimation of Tourism arrivals varies between countries based on different availability of
source data.
• Passenger Capacity vs tourism arrivals: differences might be largely due to other means
of entry to countries (land, sea) and changes to seat utilization during the pandemic.
IMF | Statistics 6Internal dissemination dashboard
• Country view: country
series, country-to-
country view down to
airport level
• Regional and Global
Indexes
• Movers: weekly
tracking country
movements
• Linked to the
database and
automatically updated
IMF | Statistics 7Value added (1)
• Precision: Total flights do not convey the full picture of how commercial
passenger air traffic is developing across countries.
IMF | Statistics Source: FlightRadar24, IMF Staff Calculations
8Value added (2)
• High-Frequency and timely data: weekly with one week lag suited to
nowcasting.
• An estimation of passenger capacity: supplementing information on the
number of flights, in the absence of publicly available detailed passenger numbers
data.
• Detail of analysis: an accompanying dashboard allows users to easily generate
weekly passenger capacity estimates down by region and country pairings.
• These enhancements are facilitating a more granular analysis of the
impacts of COVID-19 related travel disruption: especially important in
economies where tourism accounts for large share of GDP and income inflow.
• Indices facilitate multilateral comparison: such as country performance as
measured against regional (or peer country) performance.
IMF | Statistics 9Areas for enhancement
Passenger capacity vs. Number of people flying: The index does not take into account the
reduced numbers of passengers flying on individual flights and socially distanced configurations. If
we can access passenger numbers in the future, we will present those data also.
Cargo flights: We cannot at present identify flights operated by passenger airlines as cargo-only
flights. We expect that our data shows a temporary increase in such flights during the early stages of
the pandemic as passenger airlines mobilized to transport personal protection equipment. We are
currently exploring this phenomenon in an attempt to discern cargo-only flights and create dedicated
estimates to provide an overall picture of the commercial industry.
Full picture: Many small island nations heavily rely on tourist arrivals via cruise lines, which in turn
have a positive effect on their economy (ICLA, 2019). With no clear timeline for cruise operations to
resume and uncertainty on how the industry will recover, we plan to develop new estimates from
vessel traffic data as it is already being done for cargo vessels (Cerdeiro et al., 2020). These high-
frequency data will accompany air passenger capacity estimates.
IMF | Statistics 10You can also read