Data Service Market Inquiry - Dr. Onkokame Mothobi, Senior Researcher Research ICT Africa, South Africa - The Competition Commission

Page created by Elmer Baker
 
CONTINUE READING
Data Service Market Inquiry - Dr. Onkokame Mothobi, Senior Researcher Research ICT Africa, South Africa - The Competition Commission
Data Service Market Inquiry

                     Dr. Onkokame Mothobi, Senior Researcher
                                      Research ICT Africa, South Africa
                                         Competition Commission,
                                          Pretoria, 17 October 2017

Competition Commssion, South Africa
Pretoria 17th October 2018
Data Service Market Inquiry - Dr. Onkokame Mothobi, Senior Researcher Research ICT Africa, South Africa - The Competition Commission
Research ICT Africa- Evidence based policy
Data Service Market Inquiry - Dr. Onkokame Mothobi, Senior Researcher Research ICT Africa, South Africa - The Competition Commission
Research ICT Africa Mobile Pricing Index (RAMP)

 •   Voice/ SMS basket: the cost of 30 prepaid mobile voice
     calls for a total of 50 minutes, distributed between
     destinations and ‘peak’ periods, added to that of 100
     SMSs, and divided by the subscription value for the
     period of one month.

 •   Data baskets: the cost of 1 GB, 500 MB and 100 MB
     prepaid mobile data bundles, valid for monthly, weekly
     and daily periods.
Data Service Market Inquiry - Dr. Onkokame Mothobi, Senior Researcher Research ICT Africa, South Africa - The Competition Commission
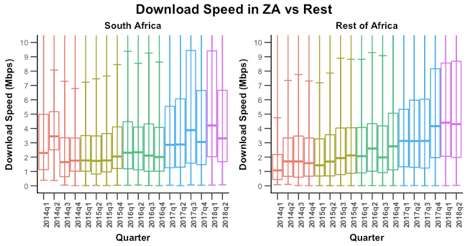
Are data prices in South Africa high?

•   The cost of cheapest of 1 GB of data is used to compare prices in
    South Africa with other African countries

•   South Africa performs poorly in the RAMP index, coming 35th of out of
    49 African countries

•   The cost of cheapest 1 GB of data in South Africa is USD 8.28 (ZAR
    99) seven times higher the cost of 1 GB in Egypt (USD 1.13) and
    nearly three times the cost of same data in Ghana, Kenya and Nigeria
SA’s Cheapest 1GB data Compared to Africa’s Top
                 Performers
        Egypt        USD 1.13
     Namibia          USD 1.25
  Mozambique            USD 1.49
      Tunisia                    USD 2.08
     Tanzania                      USD 2.23
      Guinea                       USD 2.23
       Sudan                       USD 2.28
      Rwanda                        USD 2.37
       Brundi                       USD 2.40
       Kenya                         USD 2.46
       Ghana                           USD 2.68
      Uganda                            USD 2.75
      Nigeria                            USD 2.79
  South africa                                                                USD 8.28
                 0                          2.25    4.5               6.75                 9

    FIGURE 4: SA’S CHEAPEST PREPAID MOBILE 1GB BASKETS COMPARED TO AFRICA’S TOP PERFORMERS (USD)
Source: RAMP Index, 2018
Benchmarking SA against large African Markets

     Table 1: Benchmarking South Africa against Ghana, Kenya and Nigeria

                     Comparison                   Country-level
   Affordability                  Traffic Light                    Source
                       average                      indicator
Mobile prepaid 1GB
  basket (USD)          2,64                          8,28        RIA, 2018

Dominant operator:
mobile prepaid 1GB
  basket (USD)          4,06                         10,94        RIA, 2018
Internet use                                                   GNI per capita
                                                                                                                                                                                                                            Despite   high   prices
               20000                                                                                                                                                                                                100%
                                                                                                                                                                                                                            Internet penetration in
                              86%
                                                                                                                                                                                                                            South Africa is higher
               15000                       73% 73%                                                                                                                                                                  75%
                                                                                                                                                                                                                            than      any     other
                                                                                 65%                                                                                                                                        surveyed        African
GNI per capita value

                                                                               63%
                                                       53%                                                                                                                                                                  countries
               10000                                                                                                                                                                                                50%

                                                                                                                                                             36%                                                           But     lower   than
                                                                                                                30%
                                                                                                                                      26%                                26%                                                Argentina, Colombia,
                       5000                                                                                                                                                                                         25%
                                                                                                       19% 17%                                                                                                              Paraguay and Peru
                                                                                                                                               13%                                15%
                                                                                                                                                                                     9%10%                                  and Guatemala
                          0                                                                                                                                                                                         0%
                                            Colombia

                                                                                                                                                                                              Rwanda
                                                                                                                 Nigeria

                                                                                                                                       Ghana
                                                        South Africa

                                                                                                                                                Bangladesh

                                                                                                                                                                          Kenya
                                                                                           Guatemala

                                                                                                                           Pakistan
                                                                        Peru

                                                                                                        India

                                                                                                                                                                                   Tanzania

                                                                                                                                                                                                       Mozambique
                                                                                                                                                              Cambodia
                               Argentina

                                                                                Paraguay
But Internet remains unaffordable to the low -income
                                   earners
                                                                                  The  2017 RIA After Access
                                                                                  Survey shows that low-income
                                                                                  earners pay a significantly high
             40                                                                   proportion of their disposable
                                                                                  income        to         access
                                                                                  telecommunication services
             30     32
                                                                                  The  cost of Internet or the
Percentage

                                                                                  affordability divide between the
             20                                                                   low-income and high-income
                                                                                  South Africans is creating
                                                                                  barriers to connecting the low-
             10                                                                   income earners
                                  10
                                                    0                0            The Survey shows that   almost
             0
                  0 - 1 583   1 584 - 7 167   7 168 - 16 417   16 418 - 33 333
                                                                                  50% of South Africans    do not
                                                                                  use the Internet and     further
                                                                                  these 50% are those      in the
                                                                                  bottom of the pyramid
Cost drivers

•   ~High rand-dollar exchange rate- Which affects equipment import required for
    the constant upgrading of mobile network.

•   ~Increasing costs of key inputs – Have had an inflationary effects on data
    prices

•   ~In the absence of high-demand spectrum being released to operators for
    4G: high bandwidth services are also not being deployed in the cost-effective
    manner which further exacerbate the high cost of data.

•   Regulatory issues: The failure of ICASA to put in place some mandatory and
    foundational regulation means that the wholesale facility and service market,
    which is highly imperfect by nature, does not produce the intended competitive
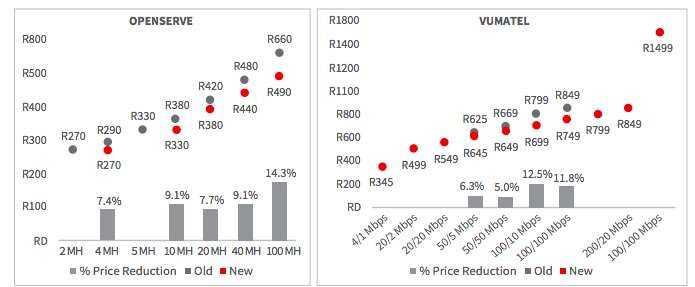
    results
Competition in data market (wholesale)

                             Competition in fibre network roll-
                             outs in South Africa was initiated
                             by the high court ruling that
                             ended Telkom’s monopoly in
                             2005.

                             The appointment of Vumatel to
                             provide fibre to home (FTTH) in
                             Parkhurst intensified intensified
                             competition in the FTTH market.

                             Though the number of players in
                             this market has increased to 35,
                             the min players: Vumatel, MTN,
                             Vodacom and Openserve owns
                             80% of the market.

                             .
Mobile Market

            Cell          MTN          Telkom          Vodacom
                                                                         The south African mobile
                                                                         market is dominated by
                                                                         two players: Vodacom and
                                                                         MTN.

 50 47      47
                   45           44                         44
                                                                  47     Using the HHI the market
                                         40     40                       is found to be highly
       37   37     37
37.5                            35       34     34         35            concentrated which n
                                                                  31
                                                                         index higher than 2500.
 25                                      23     23
                                19
                                                           17     17
       16   15     16                                                    Despite smaller players
12.5                                                                     (Cell C and Telkom)
             2      2            2       3       3          4      5     adopting a number of
       1
  0                                                                      competitive     strategies
   2010     2011   2012         2013    2014    2015       2016   2017   they have failed to gain
                                                                         substantial market share.
Pricing strategy and competition
                                                                                MTN offers the cheapest 500 MB data
202.5
                                                                                bundles for daily (ZAR 50) and weekly
                                                                                (ZAR 55) periods, but Telkom again offers
                                                                                the cheapest 500 MB monthly bundle at
 180
                                                                                ZAR 69. Similarly, MTN offers the
                                                                                cheapest 1 GB weekly bundle (ZAR 70)
                                                                                but does not compare well in the 1 GB
157.5
                                                                                monthly comparison. Vodacom’s ZAR 149
                                                                                promotional package (2 GB) offers the
                                                                                most value with an effective rate of ZAR
 135
                                                                                74.50 per GB, but Telkom’s 1 GB is still
                                                                                the cheapest at a nominal price of ZAR
                                                                                99.
112.5

                                                                                 Rain now offers the cheapest tariffs
  90                                                                            across the board: a 100 MB bundle will
  Q2 2014 Q4 2014 Q2 2015 Q4 2015 Q2 2016 Q4 2016 Q2 2017 Q4 2017 Q2 2018       cost a customer ZAR 5, significantly less
                                                                                expensive than the previously lowest
            Cell C         MTN          Vodacom           Telkom                ZAR 29 100 MB offering of Cell C, MTN
                                                                                and Telkom. Rain’s 500 MB costs less
                                                                                than half that of Telkom’s 500 MB bundle
                                                                                and also out-competes its 1 GB bundle
                                                                                price by being just about half the cost
                                                                                (ZAR 50).
Quality adjusted prices
                    Represents the ratio between the
                    1GB data basket and the average
                    download and upload speeds,
                    shows that the two dominant
                    operators Vodacom and MTN offer
                    higher quality, respectively.

                    In the same period Telkom’s quality
                    was the lowest. However, since Q1
                    2016, it seems that smaller
                    operators improved their quality,
                    catching    up    with   dominant
                    operators in Q2 2016 (in line with
                    increased network investments).
                    Vodacom SA’s high prices are
                    accompanied by higher Internet
                    speeds, compared to MTN SA and
                    Cell C, which are performing less
                    well on the measure based on
                    average download/upload speed (in
                    Mbps) divided by 1GB basket
                    costs.
Quality and Coverage

   South Africa is connected to six submarine cables.

   Telkom, Liquid Telecom South Africa (previously
    Neotel) and Broadband Infraco have made considerable
    backbone and backhaul investment over the past
    decade, giving South Africa the most extensive
    coverage in the continent

   Supplemented by recent expansion of fibre networks in
    larger metropolitan areas
Mobile operator investments
                                                                     Mobile operators have made significant
                                                                     network infrastructure investment to be
 15                                                                  able to carry vast volumes of data.

 12
                                                                     Vodacom coverage- 3G - 99.97%, 4G
                                                                     (80%)
  9

                                                                     MTN coverage- 3G - 98%, 4G (80%)
  6
              12
                                   9                                 Competition in the mobile market is no
  3                                                                  longer about pricing only, quality is
                                                    3                more critical especially in the data
  0
                                                                     market.

                    MTN              Vodacom        Cell C           Big operators are likely to win this battle
                                                                     as they are able to re-invest revenues
                                                                     gained from their large market shares

                          FIGURE 6: OPERATORS’ CAPITAL EXPENDITURES (ZAR BILLIONS) IN 2017/18
Source: Operators’ annual reports, 2017
Download speed in ZA vs Rest of the World
            (Speedchecker)

                           South Africa performs well in
                            comparison to other African
                            countries.
                           download speeds in South
                            Africa have been improving
                            due to innovations and
                            technological developments.
                           A development which can
                            be      associated      with
                            investments               by
                            telecommunication
You can also read