Austria Country Fact Sheet - Government at a Glance 2017 - OECD.org

Page created by Hazel Castro
 
CONTINUE READING
Austria Country Fact Sheet - Government at a Glance 2017 - OECD.org
Government at a Glance 2017
                                                                                     www.oecd.org/gov/govataglance.htm

                                                                               Country Fact Sheet

                                                                                    Austria

The fiscal deficit in Austria has decreased below the OECD average
After experiencing a 5.4% deficit in 2009, fiscal consolidation has brought the deficit to 1.1% of GDP in
2015, while the OECD average deficit reached 2.8% of the GDP. This is also reflected by the state of the
primary balance, which measures the overall balance excluding net interest payments on government debt,
as it reached a surplus of 0.8% of GDP in 2015. In 2016, the deficit increased slightly to 1.6% of GDP and
the primary balance fell to a surplus of 0.1% of GDP. However, the structural primary balance is expected to
remain positive in 2017 and 2018.
        Chapter 2. Public finance and economics
        General government fiscal balance as a percentage of GDP
        General government primary balance and net interest spending as a percentage of GDP
        General government structural primary balance as a percentage of potential GDP
        General government projected structural primary balance as a percentage of potential GDP

Austria has one of the most comprehensive performance budgeting frameworks
among OECD countries
The framework was introduced as part of far reaching budget reforms in 2013 which sought to improve
budgetary decision-making. In particular, the reforms focussed on designing the federal budget as a compre-
hensive steering instrument for resources, outputs and outcomes. These reforms are one of the reasons why,
between 2011 and 2016 Austria improved the most on the OECD performance budgeting indicator among
all OECD countries.
        Chapter 5. Budgeting practices and procedures
        Features of performance budgeting framework
        Use of performance budgeting practices at the central level of government

The share of women occupying cabinet positions fell below OECD average
Between 2015 and 2017 the share of women ministers in Austria decreased from 31% to 23%, while the av-
erage among all OECD countries remained around 28%. During this period, the share of women parliamen-
tarians in Austria remained above the OECD average, reaching 31% in 2017 while the OECD average was
29%. At the same time in the federal civil service 29% of senior civil servants are women, slightly below
the OECD average of 33%.
        Chapter 3. Public employment and pay
        Share of women ministers
        Share of women parliamentarians and legislated gender quotas
        Share of public sector employment filled by women
Austria Country Fact Sheet - Government at a Glance 2017 - OECD.org
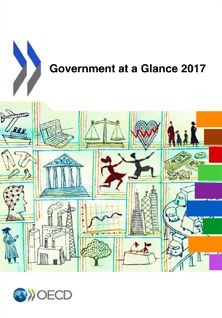
How to read the figures:
                                                                                                                                                                    Range of OECD country                       Values have been rounded.
                        Country value in blue                                         Average of OECD countries
                                                                                                                                                                        values in grey                                n.a. refers to
                     (not represented if not available)                                         in red
   Austria                                                                                                                                                                                                          data not available

                                                            Public Finance and Economics
         Fiscal balance*                                    Government expenditures                                          Government investment                                          Government gross debt*
           (2015, 2016)                                           (2015, 2016)                                                    (2015, 2016)                                                     (2015)
                     % of GDP                                                    % of GDP                                                       % of GDP                                                          % of GDP

                                                                                                                                                                                                                     101.1%              100%

         -1.6%                     -1.1%                             Austria                                                      Austria                                                          Austria
                                                                                                                                                                                                                                          0%
                                                             51.1%                                                         3.0%
         2016         Austria       2015                      2016                                                         2016
                                                                                                40.9%                                                            3.2%
                                                                                                                                                                                                                         112%            100%
                                   -2.8%
                                                             51.7%                                                         3.0%
                                                              2015                                                         2015
         2015                                                                                     2015                                                            2015                                                                    0%

-10%           -5%       0%         +5%        +10%         20%            30%      40%          50%         60%           0%           2%           4%           6%           8%               0%        50%     100%      150%    200% 250%

                                       Source: OECD                                                                                                                                                                                    Source: OECD
 * See Notes                       National Accounts                              Source: OECD National Accounts                                   Source: OECD National Accounts             * SNA definition, see Notes          National Accounts

                                                                                 Public Employment
General government employment                                                         Women in the civil service ...                                                   Percentage of central government
as % of total employment (2015)                                                                                                                                        employees aged 55 years or older
                                                                                                     44.9%                                   53.0%
                                                                                     Austria                                                                                        (2015)

                                                        15.9%
       Austria
                                                                                                                                                                                       Austria

                                                                                      0%         20%          40%         60%          80%        100%

                                                                                  ... and in senior positions (2015)
                                                                                                     28.8%                                   32.4%                                    26.1%                                 24.9%
 0%            10%         20%        30%          40%         50%
G@G /data                                                                            Austria

                                                                                                                                                                               10%            20%            30%            40%          50%

                                                        18.1%                         0%          20%          40%         60%          80%       100%
                                                                                           Source: OECD (2016) Survey on the Composition of the workforce in                      Source: OECD (2016) Survey on the Composition of the workforce in
                                          Source: OECD National Accounts                                                       Central/federal Governments                                                            Central/federal Governments

                                                                Public Sector Compensation
                                             Annual compensation across central government positions (2015)
                                                                                  Secretarial                         Senior                   Middle Managers                  Senior Managers
                                                                                   Positions                       Professionals                (D3 positions)                   (D1 positions)
                                                                    2015
                                                                 USD PPP

                                            Austria              450,000

                                                                 300,000
                                                                                                                                                                                                231,500
                                                                                                                                                                                    201,200
                                                                                                                94,600                           121,200 134,500                                     26
                                                                 150,000
                                                                                                                             88,700
                                                                                 50,400     52,700

                                                                                                                                                       Source: OECD (2016) Survey on the compensation of employees in central / federal governments
Human Resource Management
                                         Composite indicators on HRM practices in central government (2016)
                                                                                     Extent of the use                                            Use of separate
                                                Extent of delegation                  of performance               Extent of the use              HRM practices                            Collection
                                                 of HRM practices                       assessments                 of performance                   for senior                        of administrative
                                                  in line ministries                  in HR decisions                 related pay                  civil servants                            data
Composite index                         1
from 0 lowest to 1 highest

                                                                                                                      0.68                                                                 0.70            0.68
                                    0.75
                                                      0.62        0.64                           0.64                               0.66            0.65
                                                                                                                                                                   0.55
               Austria                                                                 0.49
                                    0.50

                                    0.25

                                        0
                                                                                                                                                           Source: OECD (2016) Strategic Human Resources Management Survey

         Budgeting                                                                                    Regulatory governance
  Performance budgeting                                                           Composite indices on regulatory governance for primary laws*
practices at the central level                                                                               (2014)
   of government (2016)
                                                                                                              Stakeholder                    Regulatory Impact
                                                       1                                                    engagement in                     Assessment for                             Ex post evaluation
                                                                                                         developing regulations            developing regulations                          of regulations
                       0.58                            0.8
                                                                    Composite index
                                                                    from 0 lowest to 4 highest
                                                                                                  4
  Austria

                                                                                                  3
                                                       0.6                                                                                      2.50
 Composite index                                                                     Austria                                 2.09                                2.05                     1.88
 from 0 lowest to 1 highest
                                                       0.4                                        2
                                                                                                                                                                                                            1.54
                                                                     Women in Government
                                                                               1.36

                                                       0.2                                        1
                      0.41
                                                       0                                          0
            Source: OECD (2016) Survey of Performance Budgeting     * See Notes                                                                             Source: OECD Indicators of Regulatory Policy and Governance (iREG)

                                                                           Public Procurement
     General government                                                                            Strategic public procurement - Objectives
  procurement expenditures                                                                                G@G /data
                                                                                                                     (2016)
           (2015)
      % of government expenditures
                                                                                                Support for green                          Support for                          Support for innovative
                                                                                               public procurement                            SMEs                                goods and services

         Austria
                                                                         Austria

        26.1%                           29.1%                                                    11 25 1            0                      8 24 0           1                           9 19 0                6

                                                                                                      Some procuring entities have developed an internal strategy/policy
                                                                                                      A strategy/policy has been developed at a central level
   0%        10%        20%       30%       40%       50%                                             A strategy/policy has been rescinded
                                                                                                      There has never been a strategy/policy in place

                               Source: OECD National Accounts            G@G /data                                                                                         Source: OECD (2016) Survey on Public Procurement
Open Data                                                                                                            Digital Government
                     OURdata Index:                                                                                              Individuals using the Internet for sending filled
         Open, Useful, Reusable Government Data                                                                                       forms via public authorities websites
                          (2017)                                                                                                          in the past 12 months (2016)
                      Composite index: from 0 lowest to 1 highest

                                                                                                                                                                Austria
                      Austria
          1.0                                                    1.0
                                                                                 Government
                        0.68                     0.55                            support
          0.8                                                    0.8             to re-use

          0.6                                                    0.6
                                                                                 Data                                                                        33.0%                                        35.6%
                                                                                 accessibility

          0.4                                                    0.4             Data
                                                                                 availability
          0.2                                                    0.2
                                                                                                                                                       0%               20%               40%               60%              80%

          0.0                                                    0.0
                                                             Source: OECD (2017) Survey on Open Government Data                                                                   Source: OECD, ICT database; and Eurostat, Information Society database

                                                                        Core Government Results
Satisfaction and confidence across public services                                                                             Differences in income inequality pre and post-tax
                       (2016)                                                                                                           and government transfers (2013)
                   % of citizens expressing confidence/satisfaction                                                                          0.6                                                                                  0.6
                                                                                                                                 Higher                                                                                                     Higher
                                                                                                                               inequality                                                                                                 inequality
                                            National government                                                                              0.5      0.50                                    0.47
                                                                                                                                                                                                                                  0.5
                                                    43% 42%                                                                                  0.4                             fers                               nsf
                                                                                                                                                                                                                   ers            0.4
                                                                  100
                                                                                                                                                                       trans                                tra
Austria                                                                                                                                                           nd                                 sand
                                                                                                                                                             es a                                axe
                                                                                                                                                          tax                                   t
                                                                  80
                                                                                                                              Austria        0.3
                                                                                                                                                                            0.28                                  0.32            0.3
                                                                  60
                                                                                                                                 Lower                                                                                                      Lower
                   Police                                         40
                                                                                            Health care                        inequality    0.2                                                                                  0.2     inequality

              86% 77%                                                                      88%            70%                                          Before               After             Before              After
                                                                  20

                                                                                                                                                                                                             Source: OECD Income Distribution Database

             Average
                                                                                                                                                Limited government powers (2016)
             Range

                       Judicial system                                      Education system                                0.86                                                                                                                0.75
                          68% 55%                                                 72% 67%                                                   Austria
                                                                                                                                                        0         0.2             0.4        0.6          0.8            1

                                                                                         Source: Gallup World Poll                                                                                                       Source: The World Justice Project

Notes
 Fiscal balance as reported in the System of National Accounts (SNA) framework, also referred to as net lending (+) or net borrowing (-) of government, is calculated as total government revenues minus total government expenditures.
 Regulatory governance indicators: The results for stakeholder engagement and Regulatory Impact Assessment apply exclusively to processes for developing primary laws initiated by the executive. Data is not applicable to the
United States, where all primary laws are initiated by Congress. In the majority of countries, most primary laws are initiated by the executive, except for Mexico and Korea, where a higher share of primary laws are initiated by parliament/
congress (respectively 90.6% and 84%).
 Government gross debt is reported according to the SNA definition, which differs from the definition applied under the Maastricht Treaty. It is defined as all liabilities that require payment or payments of interest or principal by the
debtor to the creditor at a date or dates in the future. All debt instruments are liabilities, but some liabilities such as shares, equity and financial derivatives are not debt.

Government at a Glance 2017
Government at a Glance provides readers with a dashboard of key indicators assembled with the goal of contributing to the analysis and international
comparison of public sector productivity and performance. Indicators on government revenues, expenditures, and employment are presented,
alongside key output and outcome data for education, health and justice. Information on key enablers to increase productivity including on digital
government, budget procedures, strategic human resource management, open government data and innovative practices are also included. In
a context of tight budget constraints in many member countries, good indicators are needed more than ever, in order to help governments make
informed decisions regarding resource allocation and to help restore confidence in government institutions.

The Excel spreadsheets used to create the tables and figures in Government at a Glance 2017 are available
via the StatLinks provided throughout the publication:
http://dx.doi.org/10.1787/gov_glance-2017-en
For more information on the data (including full methodology and figure notes)
and to consult all other Country Fact Sheets: www.oecd.org/gov/govataglance.htm
You can also read