MONTH IN PICTURES JUNE 2021
←
→
Page content transcription
If your browser does not render page correctly, please read the page content below
MONTH IN PICTURES JUNE 2021
MONTHLY SNAPSHOT
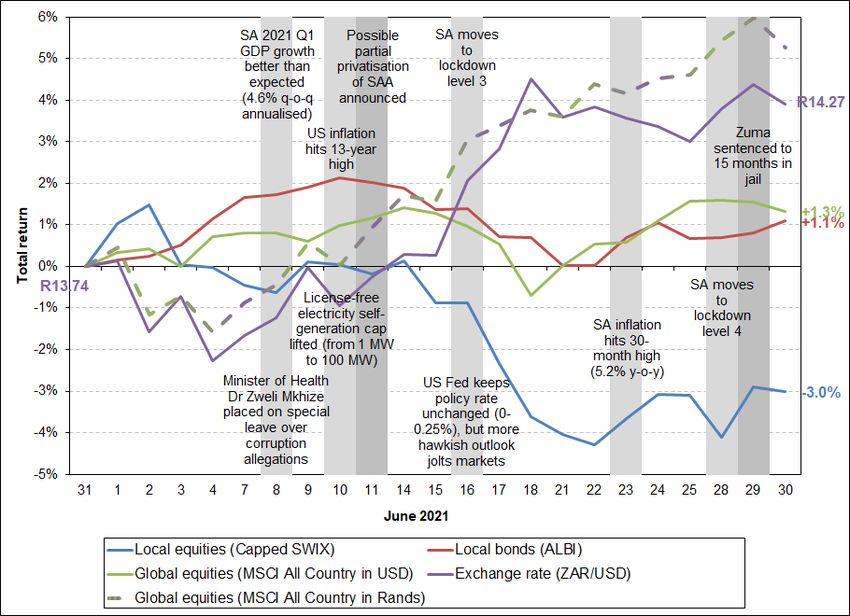
NOTABLE EVENTS
The local equity market’s winning streak was halted in June as a more hawkish outlook from the US Fed rattled global markets
(see below for details). The ALSI (-2.4%) and Capped SWIX (-3.0%) ended the month lower, with losses from Resources (-
6.4%) and Financials (-3.0%), while Industrials (+0.4%) and Listed Property (+3.4%) managed to end the month in positive
territory.
The US Fed kept their policy interest rate unchanged (at 0-0.25%), but brought forward their median projection for the first
expected rate hike(s) to 2023 (from 2024 previously), and signaling the possible near-term tapering of liquidity injections. The
faster-than-expected economic recovery, along with US inflation hitting a 13-year high of 5.4% y-o-y in June, were the major
contributors.
This news also upset the Rand, which prior to the news traded as low as R13.40 to the US Dollar, before ending the month
3.9% weaker (at R14.27/USD).
Global equity markets navigated this environment a bit better, gaining 1.3% in USD (or 5.3% in Rands).
Local bonds made gains for a third month in a row, adding 1.1% in June, while cash returned 0.3%.
Looking back at 2021 Q2, the local equity market ended the quarter essentially flat (ALSI = 0.0% and Capped SWIX = +0.6%),
with strong returns from many of the previously neglected areas of the market (mid and small caps, financials and listed
property) being offset by a slump in resource shares and Naspers/Prosus. Local bonds (+6.9%) and global equities (+3.7%)
provided positive sources of return though, resulting in most retirement funds therefore managing to produce positive, but
relatively low, returns in 2021 Q2.
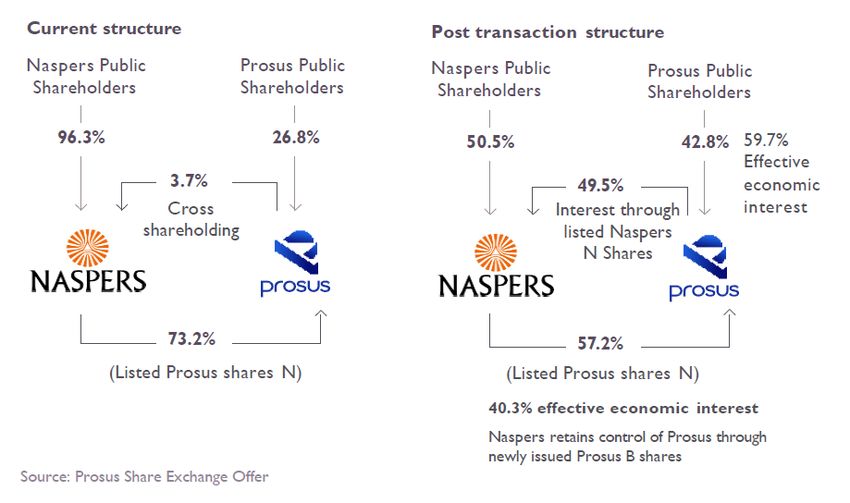
The share prices of SA’s tech darlings, Naspers and Prosus, have been under considerable pressure of late, as a combination
of continued regulatory crackdowns on Chinese tech companies (affecting Tencent, their largest investment) and
management’s latest attempt at reducing the infamous ‘discount’ failed to impress investors.
Unfortunately much of the positive news and progress made in Q2 (the electricity self-generation cap being lifted, the proposed
partial privatization of SAA, corruption fighting, large trade surpluses, etc.) was reversed early in Q3 by the unrest and
destructive looting that followed in the wake of Jacob Zuma’s arrest. Although the damage to the real economy has been
significant, the impact on local investment markets have thankfully been fairly limited, thus far (see slide 23).MONTHLY TIMELINE
IMPACT ON MARKETS
Source: IressMARKET INDICATORS
SHORT TERM
Market indicators (% change) 1 Mar 2021 Apr 2021 May 2021 3 months 12 months
ALSI 1.0 1.6 (2.4) 0.0 25.1
Capped SWIX 0.8 2.9 (3.0) 0.6 27.6
Resources 2.9 (1.2) (6.4) (5.0) 29.6
Local equities
Industrials (1.2) 1.6 0.4 0.8 19.4
Financials 1.5 9.3 (3.0) 7.5 31.3
Listed Property 11.7 (2.9) 3.4 12.1 25.2
Local bonds ALBI 1.9 3.7 1.1 6.9 13.7
Local cash STeFI Composite 0.3 0.3 0.3 0.9 4.0
Global equities MSCI All Country 2.4 (3.8) 5.3 3.7 14.6
Global bonds FTSE WGBI (0.8) (4.4) 2.8 (2.5) (17.1)
Exchange rate ZAR/USD (1.9) (5.2) 3.9 (3.4) (17.7)
Inflation CPI 0.7 0.1 0.2 1.0 4.9
1. Total returns (in Rands) for the months and periods ending 30 June 2021.
Source: IressMARKET INDICATORS
MEDIUM TO LONG TERM
Market indicators (% change) 1 1 year 3 years 5 years 10 years 15 years
ALSI 25.1 8.1 8.1 10.9 11.1
Capped SWIX 27.6 4.8 4.3 9.8 10.6
Resources 29.6 20.9 20.6 5.7 6.3
Local equities
Industrials 19.4 6.2 5.5 13.5 14.9
Financials 31.3 (3.1) 0.6 9.1 8.7
Listed Property 25.2 (8.9) (6.9) 5.1 9.5
Local bonds ALBI 13.7 9.2 9.2 8.5 8.6
Local cash STeFI Composite 4.0 6.0 6.6 6.3 7.1
Global equities MSCI All Country 14.6 16.1 13.9 18.4 12.7
Global bonds FTSE WGBI (17.1) 4.9 1.1 9.3 8.2
Exchange rate ZAR/USD (17.7) 1.3 (0.6) 7.8 4.7
Inflation CPI 4.9 3.8 4.2 5.0 5.6
1. Total returns (in Rands) for the months and periods ending 30 June 2021.
Source: IressECONOMIC INDICATORS
Economic indicators 1 Jun 2019 Jun 2020 Apr 2021 May 2021 Jun 2021
Exchange rates:
ZAR/USD 14.10 17.35 14.50 13.74 14.27
ZAR/GBP 17.89 21.52 20.03 19.53 19.75
ZAR/Euro 16.03 19.50 17.42 16.80 16.93
Commodities:
Brent Crude Oil (USD/barrel) 64.41 41.27 66.76 69.33 74.62
Platinum (USD/ounce) 833.00 811.97 1,200.98 1,182.43 1,072.50
Gold (USD/ounce) 1,409.10 1,772.86 1,772.10 1,896.49 1,761.22
1. Month-end prices
Source: IressASSET CLASS PERFORMANCE
SHORT TERM
Source: IressASSET CLASS PERFORMANCE
MEDIUM TO LONG TERM
Source: IressASSET CLASS PERFORMANCE
REAL (EXCESS ABOVE INFLATION) RETURNS
Source: IressMARKET PERFORMANCE
WHAT PAST RETURNS CAN INVESTORS
REASONABLY EXPECT?
Given the performances of the various asset classes (see earlier slides), what level of historical returns (in both nominal and real terms) can
investors reasonably have expected from the markets?
To illustrate this, we calculated the hypothetical returns of various risk profiled ‘portfolios’ (Aggressive, Moderate and Conservative) using a rules-based
asset allocation approach to cater for the change in the regulatory offshore allowance over time:
• The offshore allocation is kept at 5% below the prevailing regulatory maximum (15% to 2000, 20% to 2006, 25% to 2018 & currently at 30%).
• The equity allocation varies according to the risk profile, and is set at 75% for Aggressive, 55% for Moderate and 35% for Conservative, which
applies to both the local (ALSI up to December 2001, SWIX up to June 2011, Capped SWIX thereafter) and offshore (MSCI All Country) portions.
• The remainder of the local assets is split between local bonds (ALBI) and cash (STeFI composite), with the local bond allocation being the same
as the equity allocation in this sub-portion, i.e. 75% for Aggressive, 55% for Moderate and 35% for Conservative. The balance is kept in local
cash.
• The remainder of the offshore assets is allocated to global bonds (FTSE WGBI).
• Fees are assumed at 0.4% p.a.
A graphical representation of the strategic and current asset allocations of the various risk-profiled ‘portfolios’ are provided below:MARKET PERFORMANCE
FOR BALANCED PORTFOLIOS, WHAT RANGE OF PAST
NOMINAL RETURNS WAS REASONABLY ACHIEVABLE?
Source: IressMARKET PERFORMANCE
FOR BALANCED PORTFOLIOS, WHAT RANGE OF PAST
REAL RETURNS WAS REASONABLY ACHIEVABLE?
Source: IressMANAGER PERFORMANCE
WHAT PAST RETURNS CAN INVESTORS
REASONABLY EXPECT?
Given what markets have delivered (see earlier slides), what level of returns (in both nominal and real terms) has the average
investment manager delivered in this environment?
To illustrate this, we show the average returns from regulated collective investment schemes in the ASISA (Association for Savings and
Investments South Africa) South Africa Multi Asset High, Medium and Low Equity categories to reflect the returns of typical Aggressive,
Moderate and Conservative retirement fund portfolios.
The asset allocations of the portfolios in these categories are regulated by Regulation 28 of the Pension Funds Act, but ASISA also sets limits
on the total equity allocations of these portfolios, as shown in the graphic below:MANAGER PERFORMANCE
FOR BALANCED PORTFOLIOS, WHAT RANGE OF PAST
NOMINAL RETURNS WAS REASONABLY ACHIEVABLE?
Source: ASISA, MorningstarMANAGER PERFORMANCE
FOR BALANCED PORTFOLIOS, WHAT RANGE OF PAST
REAL RETURNS WAS REASONABLY ACHIEVABLE?
Source: ASISA, MorningstarMAJOR ASSET CLASSES
SHORT TERM MOVEMENTS
Source: IressINVESTMENT PORTFOLIO CATEGORIES
SHORT TERM MOVEMENTS
Source: ASISA, MorningstarLOCAL STOCKS
SMALL CAPS THRIVE UNDER ATTRACTIVE VALUATIONS
AND BUYOUT OFFERS, WHILE TECH GIANTS STUMBLE
Source: IressNASPERS & PROSUS
MORE COMPLEXITY TO REDUCE EVER-WIDENING
DISCOUNT…US INFLATION
HITS 13-YEAR HIGH
Source: IressSA INFLATION
CONSUMER INFLATION STARTS TO STABILISE, BUT
PRODUCER INFLATION STILL ON THE UP
Source: StatsSASA INTEREST RATES
NEGATIVE REAL RETURNS FROM CASH, LARGE GAP
BETWEEN SHORT- & LONG-TERM RATES
Source: IressSA UNREST
MARKET IMPACT OF LOOTING FAIRLY LIMITED
Source: IressYou can also read