Commercial Driver Medical Exams - Multiple Medical Conditions and Trends Over Time - FMCSA
←
→
Page content transcription
If your browser does not render page correctly, please read the page content below

Commercial Driver Medical Exams
Multiple Medical Conditions and Trends Over Time

2016 Transportation Research Board 95th Annual Meeting
Federal Motor Carrier Safety Administration
Analysis, Research, and Technology Forum
January 11, 2016

                                    Office of Research and Information Technology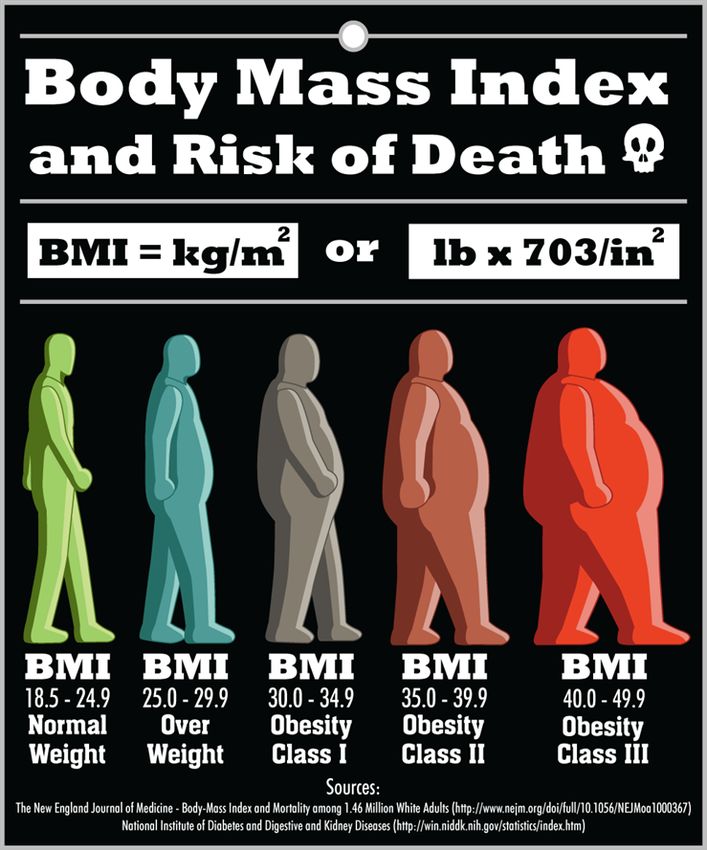
Background and Introduction Matthew Thiese, Chief Executive Officer of SafeLane Health, Inc. SafeLane Health has an online tool to help carriers and examiners track and perform exams that follow the most current guidance for medical certification of commercial motor vehicle (CMV) drivers. Received multiple grants, and currently submitting additional grants to the National Institutes of Health (NIH) and the Centers for Disease Control and Prevention (CDC). Assistant Professor at the University of Utah. Office of Research and Information Technology 1

Data Sources: Road Ready, Inc. Commercial driver medical exams (CDMEs) performed by numerous examiners in all 48 contiguous States. Study included drivers employed by private carriers and those who are independent owner-operators. Most were over-the-road or long-haul drivers. CDMEs performed between January 1, 2005, and October 31, 2012, were analyzed. Only the first CDME was analyzed when drivers had multiple, consecutive CDMEs in the database. The remaining CDMEs were excluded. Office of Research and Information Technology 2

Body Mass Index (BMI)
Data were stratified by BMI category:
− Underweight (BMI
NIH National Heart, Lung, and Blood Institute:
 Obesity Criteria

                                                https://www.nhlbi.nih.gov/
                                                health/educational/lose_w
                                                t/BMI/bmi_dis.htm

Office of Research and Information Technology                          4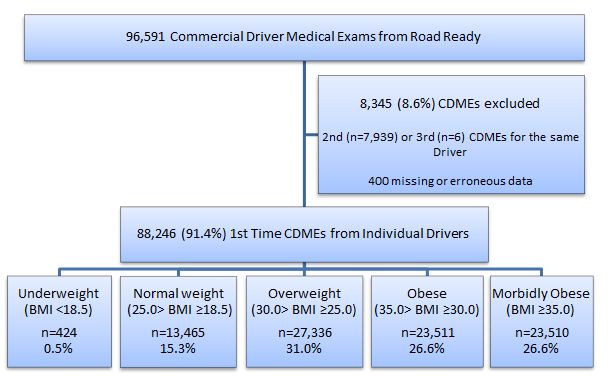
Flow Chart of CDME Data

More than half of drivers were obese or morbidly obese (total 53.2 percent).

Office of Research and Information Technology                            5
Relationships between BMI Categories and
    Demographic Data
                        Underweight                Normal weight       Overweight           Obese        Morbidly Obese
                         BMI  BMI ≥ 18.5   30.0 > BMI ≥ 25.0   35 > BMI ≥ 30      BMI ≥ 35
    Measure               n = 424                    n = 13,465         n = 27,336        n = 23,511       n = 23,510
Age (year)                    42.3                      44.6               46.9              46.9             45.1
Systolic blood
                            116.8                      121.1              125.7             128.1            130.3
pressure (BP)
Diastolic BP                  74.6                      77.4               80.5                82             83.1
                               390                     12,878             26,450            22,584           22,057
Male (#, %)
                             92.0%                     95.6%              96.8%             96.1%            93.8%
                                 34                       587                886              927             1,453
Female (#, %)
                              8.0%                      4.4%               3.2%              3.9%             6.2%
Certification
                               358                     10,940             19,417            14,470           10,870
Time: 2-year
                             84.4%                     81.2%              71.0%             61.5%             46.2%
(#, %)
Certification
                                 33                     1,748              6,145             7,261           9,942
Time: Periodic
                               7.8%                    13.0%               22.5%            30.9%            42.3%
(#, %)
Certification
Time:
                                 15                      301                798               763             1,076
Temporarily
                               3.5%                     2.2%               2.9%              3.2%             4.6%
 Disqualified
(#, %)
 Not                             18                      476                 976             1,017            1,622
 Certified (#, %)              4.2%                     3.5%                3.6%             4.3%             6.9%
   Office of Research and Information Technology                                                                     6
Comparing Driver Population with Other Studies
Sieber et al., Data from 2010 National Survey of Truck
Drivers (AJIM and JOEM, 2015).
Thiese et al., Cross-sectional Study of Truck Drivers,
conducted from 2008–10 (JOEM 2015).
Current Data
(n=88,246)
Sieber et al. Thiese et al. A = Total
Variable (n=1,265) (n=797) B = 2010
Age ~48 47.2 A=46.0 B=45.9
Percent Female 6.5% 14.1% A=4.2% B=3.7%
BMI 32.60 32.90 A=31.70 B=32.50
BMI ≥ 35 (men) 31.3% 28.8% A=26.6% B=30.1%
High blood pressure 26.3% 28.9% A=23.9% B=31.8%
Cardiovascular disease 4.4% 6.0% A=3.4% B=4.4%
Office of Research and Information Technology 7Relationships between Obesity and Driver Health
Many CMV drivers (53.2 percent) in this study are obese
and 26.6 percent have a BMI over 35.0 kg/m2.
BMI is related to many medical conditions:
− Cardiovascular issues.
− Diabetes mellitus.
− Sleep disorders.
− Lung disease.
− Shortness of breath.
− Spinal injuries or disease.
− Digestive problems.
− Illness or injuries in the past 5 years.
− Requiring vision correction.
Influences of obesity are abundant and may be beyond
those commonly recognized among CMV drivers.
Office of Research and Information Technology 8Multiple Medical Conditions
January 2010 recommendations from the Medical Review
Board (MRB) of the U.S. Department of Transportation’s
Federal Motor Carrier Safety Administration (FMCSA)
List of 13 conditions; limited certification with increasing
number of conditions.
Number of Conditions Certification Length
0 or 1 Maximum 2 years
2 Maximum 1 year
3 Maximum 6 months
4 or more Not eligible until resolution of at least one condition
MRB recommendation, January 6, 2010, for fitness for duty with
multiple medical conditions:
https://www.fmcsa.dot.gov/sites/fmcsa.dot.gov/files/docs/Final_Jan_6_2010_MRB_Meeti
ng_Summary.pdf
Office of Research and Information Technology 9Data Used from the CDME Form for Each Condition Body mass index > 35 kg/m2. Diabetes mellitus controlled by medication. Heart disease, heart surgery, or heart abnormalities. Elevated blood pressure above 140/90, hypertension medication, or self-reported history of hypertension. Corrected vision in both eyes worse than 20/40 or horizontal field of vision
Data Used from the CDME Form for Each Condition Kidney disease. Lung and chest abnormalities. Seizures or epilepsy. Spine or other musculoskeletal disorders. Stroke or paralysis. Nervous or psychiatric disorders. Opioid or benzodiazepine medication, including generic and trade names. Office of Research and Information Technology 11
Change over Time for Select Conditions
Meaningful increase in the prevalence of medical conditions.
Standards for diagnoses not changed over time for these conditions.
Office of Research and Information Technology 12Prevalence odds ratio and 95-percent confidence interval for number of
multiple conditions per year compared to 2005, adjusted for age, gender,
and body mass index
Office of Research and Information Technology 13Relationships between Obesity and Driver Health
8 of 13 conditions changed significantly over time.
Significant increases over time for:
1. Opioid or benzodiazepine use.
2. BMI >35 kg/m2.
3. Sleep disorders.
4. Hypertension.
5. Diabetes mellitus.
6. Cardiovascular disease.
7. Psychiatric disorders.
Office of Research and Information Technology 14Relationships between Obesity and Driver Health Vision problems were the only condition where the prevalence meaningfully decreased. Prevalence of multiple concomitant conditions also significantly increased. Data suggest drivers may be becoming more unhealthy over 8-year period. Office of Research and Information Technology 15
Disclosures This study has been funded, in part, by grants from the National Institute for Occupational Safety and Health (NIOSH/CDC), 1K01OH009794, and NIOSH Education and Research Center training grant T42/CCT810426-10. The CDC/NIOSH is not involved in the study design, data analyses, or interpretation of the data. Office of Research and Information Technology 16
Published Reports Thiese, M. S., Moffitt, G., Hanowski, R. J., Kales, S. N., Porter, R. J., & Hegmann, K. T. (2015). Commercial Driver Medical Examinations: Prevalence of Obesity, Comorbidities, and Certification Outcomes. Journal of Occupational and Environmental Medicine. http://journals.lww.com/joem/Citation/2015/06000/Commercial _Driver_Medical_Examinations__Prevalence.8.aspx Thiese, M. S., Moffitt, G., Hanowski, R. J., Kales, S. N., Porter, R. J., & Hegmann, K. T. (2015). Repeated Cross-Sectional Assessment of Commercial Truck Driver Health. Journal of Occupational and Environmental Medicine, 57(9), 1022-1027. http://journals.lww.com/joem/Abstract/2015/09000/Repeated_ Cross_Sectional_Assessment_of_Commercial.13.aspx Office of Research and Information Technology 17
Contact Information
 Matthew S. Thiese, PhD, MSPH
 University of Utah School of Medicine
 Rocky Mountain Center for Occupational and Environmental Health
 Email: Matt.thiese@hsc.utah.edu
 Phone: 801-587-3322

Office of Research and Information Technology                18
You can also read