Nitrogen fertilizer industry in transformation - "Two decades in review and journey ahead" - Nexant ...
←
→
Page content transcription
If your browser does not render page correctly, please read the page content below
Nitrogen fertilizer industry in transformation

“Two decades in review and journey ahead”

Dr Dimitrios Dimitriou

Senior Business Advisor Middle East
Energy & Chemicals Advisory
Megatrends and Fertilizers

There are five major socio-economic driving forces
Rapid urbanisation
Climate change and resource scarcity
Shift in global economic power
Demographic and social change
Technological breakthroughs
3
Combined population and GDP growth fertilizer
consumption growing ~10 times since 1960’s

                                FERTILIZERS

                                                6
Implications for the fertilizer industry
Fertilizer industry:
1. Urbanization results in less land available for agriculture.
2. Production of energy using hydrocarbons directly competes with producing
  hydrogen/nitrogen based fertilizers. A change in energy policy might free-up reserves
  for fertilizer production?
3. A growing population driven by birth rates and aging dramatically increases overall
  demand for food.
4. Demand for (higher quality) food increases dramatically with population rich countries
  (China and India) becoming more wealthy (increase in GDP per capita).
5. Digital technology solutions are appearing to help farmers increase efficiencies which
  may push down demand (e.g. digital soil mapping, precise agriculture, accurate
  weather forecast etc.)
6. Environmental implications of fertilizers production and use drive regulation and
  fertilizer production (eg. green ammonia) and crop technology (eg. nitrogen fixation)

                                                                                            7
The journey

Industrial nitrogen production has increased 85 times since WWII
Timeline of ammonia industry development

         19th century                  1910-1913                    1913-1934                         1946-2018

                                                               From 1 plant in 1913 to >1000 ammonia and urea plants in 2018
                    First ammonia synthesis commercial plant

      1910                  1913                  1934             1946                 2010                  2018
0.35 million tons       99% Haber Bosch

                                                                                                                        9
Some key trends over past decades – Global
                                                                                                                                Supply, Demand and trade Urea
                                                                                                            300000                                                                                                   100%

                                                                                                            200000

                                                                                                                                                                                                                           Operating Rate
                                                                                            Thousand tons
                                                                                                                                                                                                                     50%

                                                                                                            100000

                                                                                                                        0                                                                                            0%
                                                                                                                            2000                 2005             2010                   2015                 2020
                                                                                                                                    Production           Consumption          Capacity            Operating Rate

             Historic Prices vs Oil                                                                                             World Trade Urea
                                                                                                                     25000
            600                                                      120.0                                           20000

            500                                                      100.0                                           15000
                                                                                                     Thousand tons   10000
            400                                                      80.0
                                                                             $ per barrel

                                                                                                                      5000
$ per ton

            300                                                      60.0                                                   0
            200                                                      40.0                                             -5000
                                                                                                                     -10000
            100                                                      20.0
                                                                                                                     -15000
             0                                                       0.0
                                                                                                                     -20000
                  2013
                  2000
                  2001
                  2002
                  2003
                  2004
                  2005
                  2006
                  2007
                  2008
                  2009
                  2010
                  2011
                  2012

                  2014
                  2015
                  2016
                  2017
                  2018

                                                                                                                                    2000                2005           2010              2015               2020
                                                                                                                                    North America               South America                   Western Europe
                    Ammonia Arab Gulf   Urea Arab Gulf   Brent Oil                                                                  C&E.Europe                  Middle East                     Africa
                                                                                                                                    India                       China                           Other Asia Pacific
                                                                                                                                                                                                                                      11
Some outcomes of overuse

                           12
Some key trends in China
Supply, Demand and Trade Urea, China
100000 120%
90000 110%
100%
80000
90%
70000
80%
Thousand tons
Operating rate
60000 70%
50000 60%
40000 50%
40%
30000
30%
20000
20%
10000 10%
0 0%
2000 2005 2010 2015 2020
Production Consumption Capacity Operating Rate
Supply, Demand and Trade Urea, India
45000 120%
40000 110%
100%
35000 90%
Thousand tons 30000 80%
Operating rate
25000 70%
60%
20000 50%
15000 40%
10000 30%
20%
5000 10%
0 0%
2000 2005 2010 2015 2020
Production Consumption Capacity Operating Rate
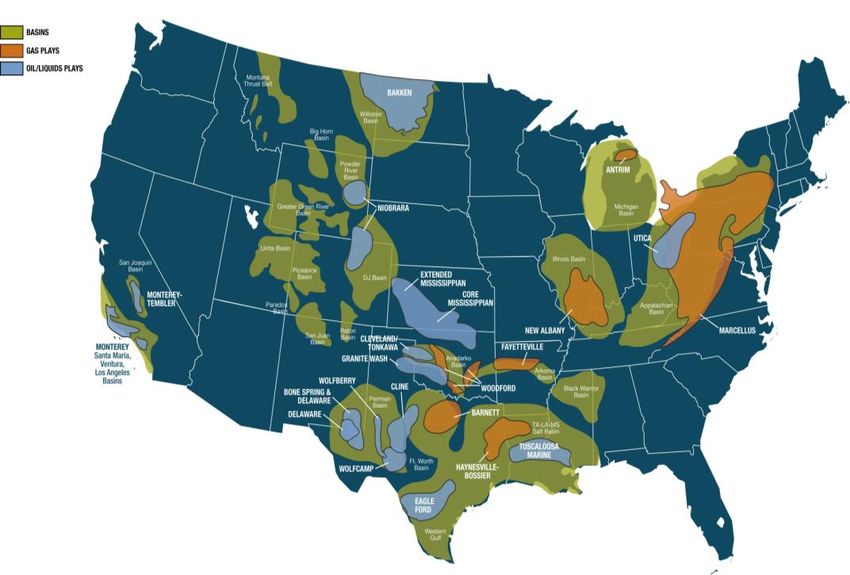
13Some key trends in North America
Basins
Gas Supply, Demand and Trade Urea
Oil
BAKKEN 25000 120%
20000 100%
80%
Operating Rate
Thousand tons
15000
60%
10000
40%
MARCELLUS 5000 20%
BARNETT 0 0%
2000 2005 2010 2015 2020
Production Consumption Capacity OpRate
EAGLE FORD
PacWest Consulting Partners
Cash Cost Margins Development
Natural Gas prices vs Oil
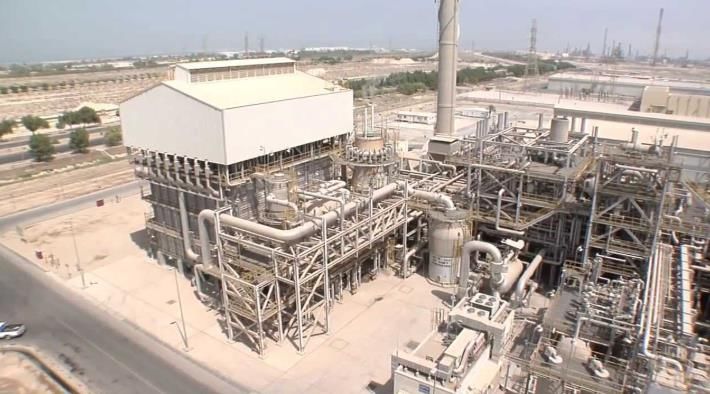
15Some key trends in the Middle East
Supply, Demand and Trade Urea
35000 100%
90%
30000
80%
25000 70%
Thousand tons
Operating rate
20000 60%
50%
15000 40%
10000 30%
20%
5000
10%
0 0%
2000 2005 2010 2015
Production Consumption Capacity Operating Rate
Urea Trade from Middle East
25000
Cash Cost Margins Development
20000
15000
10000
Thousand tons 5000
0
-5000
-10000
-15000
-20000
2000 2005 2010 2015 2020
Middle East urea exports
16Some key trends over past decades –New applications
Biodiesel Demand by region DEF Demand by region
3000
8000
7000
6000
2000
Thousand tons
Thousand tons
5000
4000
3000 1000
2000
1000
0
0
2000 2005 2010 2015
2000 2005 2010 2015 North America South America Western Europe
North America South America Western Europe C&E.Europe Middle East Africa
C&E.Europe Middle East Africa India China Other Asia Pacific
17Some key trends over past decades –New products
North America
18% South America
0.3%
Western Europe
4%
Eastern Europe
0.2%
Middle East
1%
Africa
Asia Pacific 0.1%
(including China)
77%
4 million tons in 2017
(growing at >5% CAGR)
18Nexant views - past
Fertilizer overuse and environmental impact!
Shale gas development and significant decoupling of natural gas prices in the US
from crude oil
Competitiveness position of US producers improved significantly
Producers in KSA enjoy a strong advantage on a cash cost basis due to low gas
cost, but limited gas resource for new projects and threat from other exporters rising
China become a large net exporter of urea threating global market – net exports
recently declined; supply and demand side reforms.
India and SEA main importing markets
Africa in focus: under application, large resources and population growth
From a buoyant market in until mid 2010’s to an oversupplied market today
20The road ahead?
Some key trends to follow?

                             22
Nexant views - future
Consistent long term growth due to rising population but at lower rates due to
fertilizer over-application, regulation and nutrient stewardship in major consuming
markets
New products/new markets and new strategies for players in effort to create and
capture value
Digitalisation impacting demand and supply?
India emerging as a key producer?
China further capacity rationalisation, growing environmental drive and lower
exports;
Middle East continued position as low cost, volume exporter but competitive threat
rising; need for new business strategies!
Protectionism impacting market - Government changes can lead to trade tensions
Policy developments are a major driver of future fertilizer supply and demand
China, fertilizer consumption growth has been capped and supply decreasing
India, the government is considering options to improve the effectiveness of its
fertilizer subsidy scheme and become self sufficient
Africa emerging a major consuming and producing centre?
23Nexant, Inc.
San Francisco
“This presentation was prepared by Nexant Limited (“Nexant”). Except where specifically stated otherwise
New York
in the presentation, the information contained herein was prepared on the basis of information that is Houston
publicly available and has not been independently verified or otherwise examined to determine its Washington
accuracy, completeness or financial feasibility. Neither NEXANT, nor any person acting on behalf of
NEXANT assumes any liabilities with respect to the use of or for damages resulting from the use of any London
1 King’s Arms Yard, information contained in this presentation. NEXANT does not represent or warrant that any assumed Bahrain
London, EC2R 7AF conditions will come to pass. Bangkok
This presentation is integral and must be read in its entirety.
Shanghai
Telephone: +44 20 7950 1600 The presentation is given on the understanding that the recipient will maintain the contents confidential
except for internal use. The presentation should not be reproduced, distributed or used without first
Kuala Lumpur
Facsimile: +44 20 7950 1550
obtaining prior written consent by NEXANT. This presentation may not be relied upon by others.
www.nexant.com This notice must accompany every copy of this presentation.” www.nexant.comYou can also read