PT Bukit Asam Tbk
Corporate Presentation FY2020
←
→
Page content transcription
If your browser does not render page correctly, please read the page content below
PT Bukit Asam Tbk Corporate Presentation FY2020
•   Company Overview

  •   FY2020 Update
  •   Business Strategy and Update on Key Projects

Strictly Confidential
                                                     miningindustry.id   2
Corporate Structure and Group Overview
PT Indonesia Asahan Aluminium (Persero) owns
~65,93% of total shares
The Subsidiaries and Indirect Subsidiaries
Mining Trading Power Logistics Gas Investment Others
Mining Power Gas Others
Trading Logistics Investment
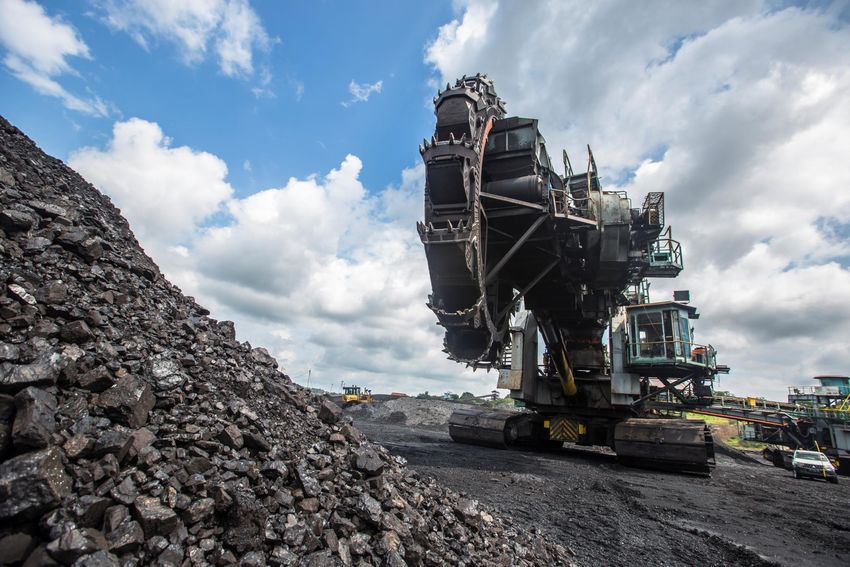
PTBA continues to diversify its source of revenues – The Company’s core coal mining business is supported by the
development of other businesses in power generation, logistic, coal beneficiation, investment and others.
3
PTBA Among Peers 9M20
  2020 Coal Production                                                                       2016 - 2019 Production CAGR
  ((million ton)
                                                                                              (%)
                                                                                                                                                         34%

                                                                                  54.5
                                                                                                                                                11%
                                                                          34
                                                                 23.9                                      n.a.      n.a        n.a      1%
                                    19.4         21.5
                    13.8
        n.a
                                                                                                   -8%
        Bumi       ITMG             PTBA         Bayan          Golden   Indika   Adaro            ITMG    Bumi    Golden      Indika   Adaro   PTBA     Bayan
                                                                Energy                                             Energy

                              (1)
  2020 EBITDA Margin                                                                         2020 Weighted Average Stripping Ratio
  (%)                                                                                        (x)

                                                                                                                                                         10,0x
                                                                                  35%

                                                                         24%                                                                    5.9x
                                                                 22%
                                                                                                                     3,8x.      4.3x    4,4x
                    14%             14%          14%

        n.a                                                                                         n.a.    n.a
                            (1)            (1)            (1)
        Bumi       Golden           ITMG         Indika         Bayan    PTBA     Adaro            Bumi    Adaro    Golden     Bayan    PTBA    Indika   ITMG
                   Energy                                                                                           Energy

    Source: Internal Analysis.
    (1) Adjusted EBITDA.
    (2) Production CAGR between 9M16-9M20

                                                 PTBA is one of the fastest growing and lowest cost coal producers in Indonesia

                                                                                                                                                                 4
Actions Taken by PTBA to Mitigate The Covid-19 Outbreak

     PPE           TRANSPORTATION       MEDIC             IT   ACTIVITIES

           APD

                                    3

                                                                            5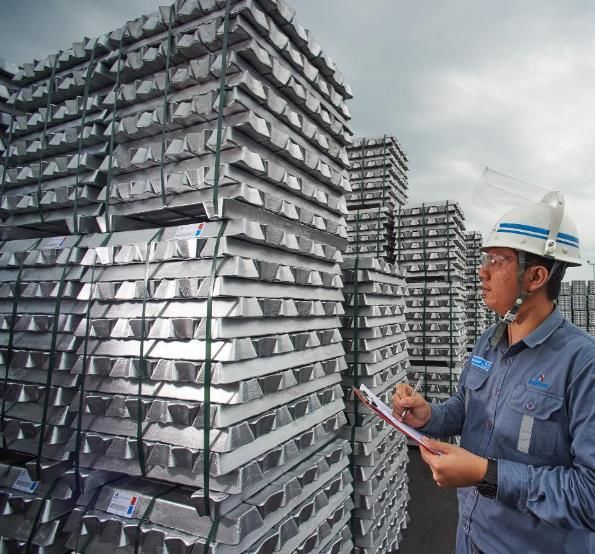
PTBA Supports The Community

                763                       303,695                           112
           Handsanitizer                                                Unit Tedmond &
           400 ml & 60 ml                        Mask                  Portable Wastafel

           Spraying of
           Disinfectants in
           the Company's                    26 Ton                            10
           Ring 1 Area                           Rice                         box

                700                         107,720                       3,750
          Protection Clothes
                                                                        Rosela for Health
          dan Protective                   Groceries Packages
                                                                            Workers
          Goggles

                                IDR 23.8 Billion
                               Total Fund Realization on Covid up to
                                         December 2020

                                                                                            6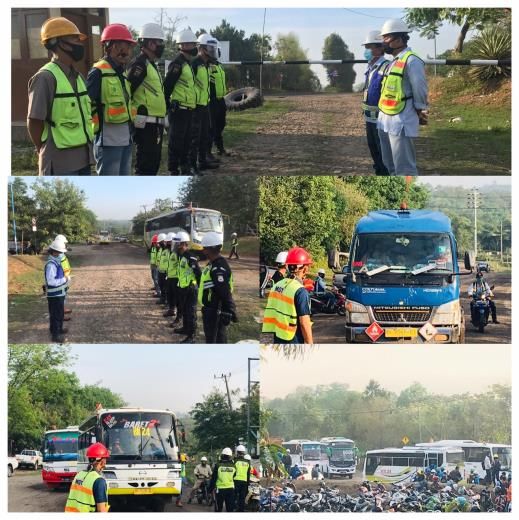
•   Company Overview

  •   FY2020 Update
  •   Business Strategy and Update on Key Projects

Strictly Confidential
                                                     miningindustry.id   7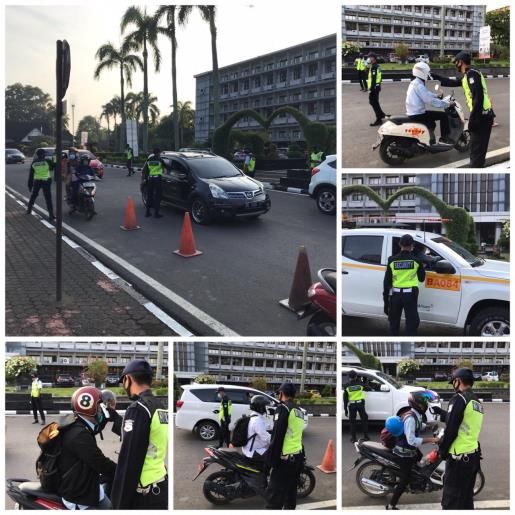
Key Performance Highlights

                                                                                YoY
                                            FY 2021 E   FY 2020   FY 2019
                                                                            (% change)

 Sales Volume (Mt)                            30.7       26.1      27.8       -6.1

 Production Volume (Mt)                       29.5       24.8      29.1       -14.8

 Railway Volume (Mt)                          28.2       23.8      24.2       -1.7

 Revenue (IDR TN)                             N.A        17.3      21.8       -20.6

 Net Profit (IDR TN)*                         N.A         2.4       4.1       -41.5
 Weighted Average                                       653,507   769,670     -15.1
                                              N.A
 Selling Price (IDR/t)
 Stripping Ratio (x)                           5.1        4.4      4.6        -4.3
Note: *net profit after minority interest

                                                                                         8
Key Operation Highlights
Coal Production                                                                                                         Railways Capacity
(million ton)                                                                           Production      Sales           (million ton)

                                                                           29.1
                                                                                    27.8
                                                    26.4                                               26.1                                                                                   24.2                23.8
                            24.2      23.6                   24.7                              24.8                                                                        22.7
                                                                                                                                                      21.4
     19.6      20.8
                                                                                                                                17.7

        FY2016                 FY2017                  FY2018                 FY2019             FY2020                        FY2016                FY2017               FY2018             FY2019              FY2020

 Weighted Average Stripping Ratio                                                                                  Sales Breakdown by Country (1)                            Sales Breakdown by Quality (1)
 (x)                                                                                                               (%)                                                       (%)

                                                                                                                                      Thailand, 3%                                    Bukit Asam-45
                                                                                                                                                      Malaysia, 2%                          3%
         4.9                                                                                                      Korea Selatan, 3%                                                                        (3)
                                                                              4.6                                                                        Vietnam, 2%                            Other 9%
                                                                                                 4.4             Hongkong, 5%                                                Bukit Asam-64
                                                       4.1                                                                                               Others, 5% (2)            3%
                                3.6                                                                               Taiwan, 6%
                                                                                                                                                                                  GAR 6100
                                                                                                                                                                                    5%
                                                                                                                  China, 7%
                                                                                                                                                                            Bukit Asam-46
                                                                                                                                                                                  7%                                Bukit Asam-50
                                                                                                                India, 13%
                                                                                                                                                                                                                         52%

                                                                                                                                                                            Bukit Asam-48
                                                                                                                                               Domestic,                         22%
      FY2016                 FY2017                 FY2018                 FY2019              FY2020                                            54%

   (1) Breakdown based on sales distribution per ton.
   (2) Others include Philippines , Japan, Australia, Cambodia, Pakistan, Brunei Darussalam.
   (3) Others include Bukit Asam-67, Bukit Asam-47, GAR6700 dan GAR 46-IPC.

                                                                                                                                                                                                                                    9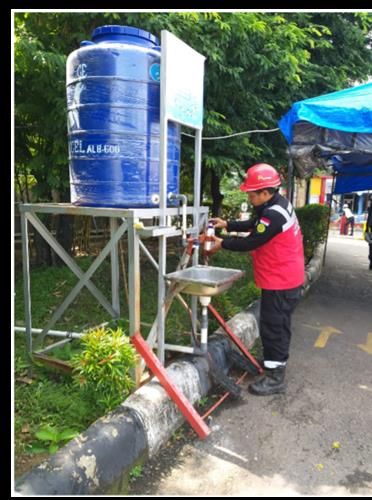
Key Financial Highlights
Revenue and Growth                                                               Gross Profit and Margins
(IDR billion)                                                                    (IDR billion)

     1.5%             38.5%          8.7%                2.9%          - 20.5%      31.3%            43.7%     40.4%                     34.9%   26.4%

                                    21,167              21,788
                      19,471                                                                         8,507      8,546
                                                                                                                                         7,612
                                                                       17,325
     14,059                                                                         4,401                                                         4,566

    FY2016           FY2017         FY2018             FY2019         FY2020       FY2016           FY2017     FY2018                  FY2019    FY2020
              Revenue (IDR bn)          Growth (%)                                              Gross Profit   Gross Profit Margin (%)

Operating Profit and Margins                                                     Net Profit and Margins
(IDR billion)                                                                    (IDR billion)

     18.0%            30.3%          29.5%               23.0%         14.6%         14.3%           23.0%      23.7%                    18.6%   13.8%

                                    6,224                                                                       5,024
                      5,899                                                                          4,476
                                                       5,014                                                                             4,057

                                                                                                                                                  2,387
     2,531                                                            2,520         2,006

    FY2016           FY2017         FY2018            FY2019          FY2020       FY2016           FY2017     FY2018                  FY2019    FY2020

                 Operating Profit       Operating Profit Margin (%)                               Net Profit   Net Profit Margin (%)

                                                                                                                                                          10
Key Financial Highlights (cont.)
EBITDA and Total Debt (1)/ EBITDA Ratio Minimal Debt (1) with Overall Net Cash Position (2)
(IDR billion) (IDR billion)
0.7x 0.1x 0.1x 0.1x 0.1x 1,306 2,582 5,469 4,126 3,918
6,301
7,582 4,757
6,830 6,391 4,341
3,675 3,555
4,381
3,297 2,369
974 832 631 423
FY2016 FY2017 FY2018 FY2019 FY2020 FY2016 FY2017 FY2018 FY2019 FY2020
EBITDA Total Debt/EBITDA (x) Cash & Equivalents Total Debt Net Cash
Low Leverage(1) Min. 30% Dividen Payout Ratio Over The Last Few Years Cost Breakdown
(%)
Cash cost (3) % Peningkatan
FY20 FY19
22% 7% 5% 3% 2% (IDR ‘000/t) (Penurunan)
90% Total
Total 535 581 (8.0)
75% 75% Land & Building Taxes; 1%
Donation; 1%
Sparepart; 3% Others; 9%
30% Fuel & Lubricants; 3%
Rental of heavy
n.a. equipment; 3%
Coal Railway; 31%
Third party services; 5%
FY2016 FY2017 FY2018 FY2019 FY2020
Dividend Payout Ratio Total Debt/Equity Royalty & Retribution; 6%
Depreciation & Mining Services; 20%
(1) Total debt includes bank borrowings and lease obligations, except lease obligations of PSAK 73. Amortisation; 7% Salaries; 11%
(2) Net cash not included deposits more than 3 (three) months.
(3) Total Cash Cost include COGS, G&A, Selling Expenses, Inventory and Royalty, exclude Depreciation and Amortisation 11• Company Overview
• FY2020 Update
• Business Strategy and Update on Key Projects
Strictly Confidential
miningindustry.id 12PTBA’s Strategic Guidelines
Vision:
A world-class energy company that cares about environment
Mission:
Manage energy resources by developing corporate competencies and human excellence to provide maximum value for the stakeholders and environment
1 2 3 4
Aggressive Exploration & Cost Leadership Beyond Coal – Beyond Coal –
Production Growth Focused on Build world-scale downstream Strategic alliances for new
Economic Value assets downstream expansion
• Acquire coal reserves • Tech-enabled Operations via • Coal to power • Coal to chemicals
Digital Mining
• Increase logistics capacity • Power Plants to support • Activated carbon
• Operational Excellence other MIND ID projects
• Renewable energy
Across Value Chain
E
Enabler – Capability Building and Portfolio Optimisation
Organization
Financing & Cash HSE CSR Integrated
Rejuvenation & BACBIE Subsidiary Restructuring
Management Management Improvement Marketing
Transformation Unit
13PTBA’s Strategic Focus
Coal Transportation Expansion
• Expansion of Coal Railway capacity
• Development of alternative coal transportation options
Power Plant
• Minemouth Coal Power Plant
• Coal Power Plant to support Mining Industry
Towards world class energy • Other Power Plant including Renewable Energy
company and beyond coal
aspiration
Coal to Downstream Industries
• Coal to Chemicals (DME, etc)
• Coal to Activated Carbon
14Update On Key Projects
• The biggest CFPP in Sumatera ; The biggest Mine Mouth CFPP in Indonesia
Mine Mouth Coal Fire Power
• Construction progress 66,8 % as of December 2020
Plant Sumsel 8 • COD in Q1-2022
• Coal to DME 1.4 Mtpa
Coal to Chemical • Finalization Cooperation Agreement
• Construction to start in 2021 and COD targeted in Q2-2024
• Coal to Activated Carbon 12 Thousand Tons
• Signed a Heads of Agreement (HoA) with Activated Carbon Technologies PTY, LTD
Coal to Activated Carbon (ACT), as an offtaker
• Plant’s Front-End Engineering Design (FEED) in 2021
• Tanjung Enim – Kertapati upgraded up to 7 Mtpa
• Kertapati capacity has reached the project target of 5 Mtpa and will be increased to
7 Mtpa in 2021, where currently preparations for major repair are in the framework
of 7 Mtpa
• CoD targeted in Q3-2021
Development Existing Railway
• Tanjung Enim – Tarahan upgraded 25 Mtpa
• Construction for railway track and signal system
• COD targeted in Q3-2021
• Northern South Sumatera (Kramasan) Capacity 20 Mtpa
• Signed Head of Agreement (HoA) PTBA – KAI
• COD targeted in Q1-2024
New Port & Railways
• Southern Lampung (Tarahan 2) Capacity 20 Mtpa
• On process for issuing of permits including AMDAL
• COD targeted in Q2-2025
15You can also read