Carbon Sequestra.on and THPs An RPF's approach to AB 1504
←
→
Page content transcription
If your browser does not render page correctly, please read the page content below
Carbon
  Sequestra.on
  and
  THPs

 An
  RPF’s
  approach
  to
  AB
  1504


          Bill
  Stewart
  and
  Benktesh
  Sharma

           hDp://ucanr.edu/sites/forestry/


  hDp://ucanr.edu/sites/cff/


          BOF
  Public
  Workshop
  on
  AB
  1504

                      September
  5,
  2014
Key points • PRC 4512-‐4513 has a few key goals (maintain (mberland produc(vity, produce high quality products, give due considera(on to related public benefits including a new one from “AB 1504, Skinner. Forest resources: carbon sequestra.on”) • Carbon sequestra.on is a rate per year; carbon sinks may be expanding, shrinking, or constant • Climate benefits measured by society-‐wide emission reduc.ons/carbon sequestra.on related to forest and forest products are spread across many GHG emission sectors in both ARB and USEPA accoun.ng
A
  warning
  for
  modelers

     Projec.ng
  Mature
  Forest

 Sequestra.on
  rates
  over
  the
  next

   decade
  is
  a
  complex
  task
  with

    numerous
  examples
  of
  large

  divergence
  between
  empirical

measurements
  and
  model
  es.mates
Same
place,
same
journal
–
but
carbon
measurements
are
different
than
carbon
models
• Turner
DP,
RiDs
WD,
Yang
Z,
Kennedy
RE,
Cohen
WB,
Duane
MV,
Thornton
PE,
Law
BE.
2011.
Decadal
trends
in
net
ecosystem
produc.on
and
net
ecosystem
carbon
balance
for
a
regional
socioecological
system.
Forest
Ecology
and
Management
262:
1318-‐1325.
• They
modeled
~150
gCm-‐2yr-‐1
of
new
carbon
sequestra.on
on
public
lands
in
PNW
from
1995
to
2007
• Gray
AN,
Whiier
TR.
2014.
Carbon
stocks
and
changes
on
Pacific
Northwest
na.onal
forests
and
the
role
of
disturbance,
management,
and
growth.
Forest
Ecology
and
Management
328:
167-‐178.
• They
measured
0.63
gCm-‐2yr-‐1
of
new
carbon
sequestra.on
on
public
lands
in
PNW
from
1995-‐2002
• Take
Home
Message:
Forest
disturbances
in
mature
forests
are
poorly
captured
by
many
growth
models
100
Year
Forest
Management
Produc.vity
Quasi-‐Experiment:
Heavy
thinning,
light
thinning,
no
thinning
–
Harvest
+
Inventory
3:1:0.5
300
High
site
(FIA
>site
3
Sierra
Mixed
Conifer
Forests)
All live trees
65 cm dbh
300
2ha00
−1
200
MgCha-‐1
0
100
MgC
+
+
+
+
100
+
+
+ +
+
+ + +
0
Blodgett Forest National Forest Timberland Parks and Roadless Area Forests
BlodgeD
(n=
751)
USFS
Timberlands
(n=751) (n=206)(n=
206)
Reserve
Forests
((n=68) n=
68)
200
A
life
cycle
analysis
for
assessing
forest
management
impacts
on
carbon
sequestra.on
• CA
FPR
is
all
about
the
full
life
cycle
–
forest
now
and
post-‐treatment
or
post-‐disturbance,
high
quality
products,
work
to
limit
scope
of
wildfires,
etc.
• Reforesta.on
is
required
by
law
arer
harvests
• USFS
FIA,
TPO
and
FPL
regularly
improve
analysis
of
average
and
best
prac.ces
for
the
whole
forest
value
chain
• California’s
output
of
~
½
high
quality
products
and
~
½
bioenergy
(Morgan
2012)
requires
the
considera.on
of
wood
products
and
energy,
in
addi.on
to
es.mated
changes
in
forest
carbon
inventories
Steps
for
genera.ng
forest
type
&
silviculture
specific
AB1504
es.mates
for
THPs
with
the
tool
at
hDp://ucanr.edu/sites/forestry/
Carbon_Sequestra.on_Tool_for_THPs/
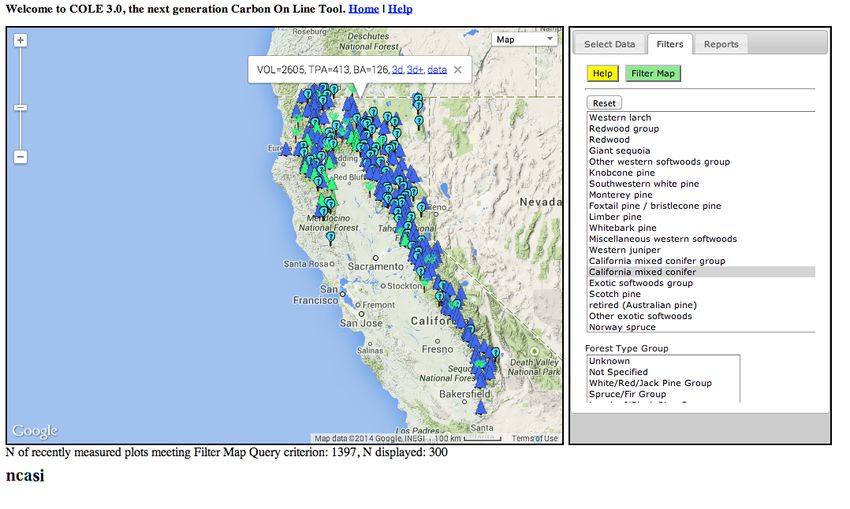
• Accessing
public
FIA
data
with
COLE3
to
create
relevant
baselines
• Use
same
forest
growth
model
for
poor/nonstocked,
let-‐
grow,
and
managed
forest
scenarios
• Check
that
professional
(mbf/ac)
can
be
translated
to
climate
(Carbon
tons/ha)
units
• Compare
relevant
forest
management
op.ons
for
relevant
forest
type
• Project
carbon
sequestra.on
benefits
in
regenera.ng
forest
AND
products
used
by
society
• Sum
up
the
carbon
sequestra.on
benefits
by
where
they
occur
hDp://www.ncasi2.org/GCOLE3/gcole.shtml


The
  database
  summarizes
  one
  point
  in
  .me
  es.mates
  of
  forest
  carbon
  and
  generates

‘carbon
  reports’
  for
  selected
  forest
  types.
  FIA
  is
  scheduled
  to
  release
  the
  California
  FIA

report
  with
  carbon
  sequestra.on
  by
  owner
  class
  in
  2015
MBF/ac
  and
  MgC/ha
  measurements

  are
  reasonably
  well
  correlated


                            Source:
  Benktesh
  Sharma
  analysis

                            of
  FIA
  data
  for
  California
Use
  baseline
  or
  new
  input
  variables

MixCon Even T40H80U75 - Mixed Conifer Even aged thin@yr40, harvest@yr80, utilize 75% of logging slash for bioenergy and leave rest

2 20 2014 analysis CMC live tree tC/ha - all forest til
80, then faster growing private forest for 80

                                                                                                                                                  Color Key

Based on y = a(1 − e^(−b∗AGE))^3 - Von Bertalanffy
growth equation

                                                                                                                   Input
              Any input that can be changed by user
from COLE:Carbon On Line Estimator                      www.ncasi2.org/COLE/                                       Calcula&on
         Intermediate calculation.
                                     all cmc        pvt cmc        cmc - poor or non-stocked                       Linked
  Cell
     The cell is linked to some other cells.
FIA est. of live tree carbon/ha               121.4            84.4                                                Output
             Output value produced
Von Bertalanffy growth equation coefficients                                                                       Note/remarks
       Any remark or default value is described
a                                            168.03
        110.94
            39.64
b                                               0.02
         0.04
             0.04
std error                                    120.14
         77.91
            27.97
No of FIA plots in COLE2 dataset               1374
           351
              241

                                     Used-          Used-
                                     Bioenergy Products            Unused             Remarks

                                                                                   Based on partial
                                                                                   thinnings(72% chips, 28%
                                                                                   sawlogs) in Stewart and
Thinning utilization                            0.72        0.28
                 Nakamura (2012)

                                                                                   Default 0.75 used, 0.25
                                                                                   unused logging residues
Logging slash - use/leave ratios                 0.75
          0
           0.25
  left to decompose on site

                                                                                   Default 0.24 usedfor
                                                                                   energy, 0.75 into                                           (Morgan et al. PNW-GTR-866.
Sawmill energy/product/waste ratios           0.24
        0.75
             0.01products, 0.01 waste                                        2012)
1:1 Substitution benefits applied wood products                                    57% of wood products go into buildings where substitution benefits are significant (FPL-
used in buildings (McKeever 2011)                           0.57
             0.43
  GTR-199, McKeever 2011)
hDp://ucanr.edu/sites/forestry/Carbon_Sequestra.on_Tool_for_THPs/
Climate
Benefits
of
California
Mixed
Conifer
Forest:
Where
benefits
get
accounted
for
Forest&Products
v
Let-‐Grow
Forest
With
Year
40
thin
and
75%
u&liza&on
of
logging
residues
US
EPA/
ARB
sector
350
Subs.tu.on
Benefits
for
~57%
of
wood
going
into
buildings
Dispersed
across
products
and
energy
Energy
from
post-‐consumer
300
residues
Elec.
Gen.
Elec.
Gen.
Climate
Benefits
in
Tonnes
of
Carbon
per
Hectare
Landfill
storage
250
SWDS
Recycling
Wood
products
Forestry
NA
200
Energy
from
sawmill
residues
Energy
Industrial
150
Energy
from
logging
residues
Elec.
Gen.
Elec.
Gen.
100
Regenerated
forest
Forest
Forest
50
Logging
slash
ler
Forest
Forest
0
Let-‐grow
forest
Forest
Forest
-‐80
-‐60
-‐40
-‐20
0
20
40
60
80
100
120
140
160
Project
Year
Average
Annual
Climate
Benefits
in
Mixed
Conifer
Forests
in
MgCha-‐1
Scenario
Live
trees
Wood
Bioenergy
Landfill
Building
Total
and
down
Products
storage
Product
Benefits
wood
Subs&tu&on
Benefits
Let
Grow
–
77
0
0
0
0
77
160
years
Manage
-‐
43
12
26
6
12
99
160
years
Let
Grow
–
104
0
0
0
0
104
240
years
Manage
-‐
47
19
48
15
20
149
240
years
Based
on
a
disturbance
free
growth
model
(an
overes.mate
for
most
California
forests)
for
both
let-‐grow
and
managed
forests
(this
examples
is
an
even
aged
system),
managed
forests
are
projected
to
provide
more
overall
climate
benefits
when
benefits
across
all
sectors
are
considered.
Varia.ons
by
forest
type
and
silviculture:
MgC
ha-‐1
yr-‐1
over
a
160
year
cycle
Mixed
Ponderosa
Douglas-‐
Redwood
conifer
pine
fir
Poor
or
Nonstocked*
28
25
36
36
Let
Grow
-‐
past
and
future
79
63
160
217
rota.ons
(no
disturbance)
Even
–
T@40,H@80,U00
87
85
203
226
Even
-‐
T@40,H@80,U25
91
89
213
237
Even
-‐
T@40,H@80,U75
99
98
233
260
Uneven
-‐
102
96
235
285
T@40,H@80,U75,20+
T@
-‐
thin
year,
H@
-‐
harvest
year,
U
-‐
%
of
logging
slash
collected
for
energy,
20+
-‐
harvest
cycle
Managed
stands
provided
4-‐35%
more
sequestra.on
when
all
sectors
are
considered
Key Findings • A life cycle analysis approach is a beDer match for a forest management project but may not roll up as easily into some GHG accoun.ng schemes • The significant unknowns are how threats and changing climate will affect future forest growth • Good forest management at all stocking levels provides more carbon sequestra.on for California • California’s Forest Prac.ce Rules were climate-‐friendly before AB 1504 – but now require addi.onal documenta.on • The UC spreadsheet model is available at hDp://ucanr.edu/sites/forestry/ Carbon_Sequestra.on_Tool_for_THPs/ • UCCE Forestry Specialists and Advisors are engaged in the forest*climate nexus
You can also read