CIBC 2018 Whistler Institutional Investor Conference January 25, 2018 Russ Girling, President & CEO - TransCanada

Page created by Herbert Figueroa
 
CONTINUE READING
CIBC 2018 Whistler Institutional Investor Conference January 25, 2018 Russ Girling, President & CEO - TransCanada
CIBC 2018 Whistler Institutional Investor Conference
January 25, 2018

Russ Girling, President & CEO
CIBC 2018 Whistler Institutional Investor Conference January 25, 2018 Russ Girling, President & CEO - TransCanada
Forward Looking Information and Non-GAAP Measures
This presentation includes certain forward looking information, including future oriented financial information or financial outlook, which is intended to help current and
potential investors understand management’s assessment of our future plans and financial outlook, and our future prospects overall. Statements that are forward-looking
are based on certain assumptions and on what we know and expect today and generally include words like anticipate, expect, believe, may, will, should, estimate or other
similar words.
Forward-looking statements do not guarantee future performance. Actual events and results could be significantly different because of assumptions, risks or uncertainties
related to our business or events that happen after the date of this presentation. Our forward-looking information in this presentation includes statements related to:
future dividend growth and the future growth of our core businesses.
Our forward looking information is based on certain key assumptions and is subject to risks and uncertainties, including but not limited to: our ability to successfully
implement our strategic initiatives and whether they will yield the expected benefits, the operating performance of our pipeline and energy assets, economic and
competitive conditions in North America and globally, the availability, demand for and price of energy commodities and changes in market commodity prices, the amount
of capacity sold and rates achieved in our pipeline businesses, the amount of capacity payments and revenues we receive from our energy business, regulatory decisions
and outcomes, outcomes of legal proceedings, including arbitration and insurance claims, performance and credit risk of our counterparties, changes in the political
environment, changes in environmental and other laws and regulations, construction and completion of capital projects, labour, equipment and material costs, access to
capital markets, interest, inflation, tax and foreign exchange rates, weather, cyber security and technological developments. You can read more about these risks and
others in our November 8, 2017 Quarterly Report to Shareholders and 2016 Annual Report filed with Canadian securities regulators and the SEC and available at
www.transcanada.com.
As actual results could vary significantly from the forward-looking information, you should not put undue reliance on forward-looking information and should not use
future-oriented information or financial outlooks for anything other than their intended purpose. We do not update our forward-looking statements due to new information
or future events, unless we are required to by law.
This presentation contains reference to certain financial measures (non-GAAP measures) that do not have any standardized meaning as prescribed by U.S. generally
accepted accounting principles (GAAP) and therefore may not be comparable to similar measures presented by other entities. These non-GAAP measures may include
Comparable Earnings, Comparable Earnings per Share, Comparable Earnings Before Interest, Taxes, Depreciation and Amortization (Comparable EBITDA), Funds
Generated from Operations, Comparable Funds Generated from Operations, Comparable Distributable Cash Flow (DCF) and Comparable DCF per share. Reconciliations to
the most closely related GAAP measures are included in this presentation and in our November 8, 2017 Quarterly Report to Shareholders filed with Canadian securities
regulators and the SEC and available at www.transcanada.com.
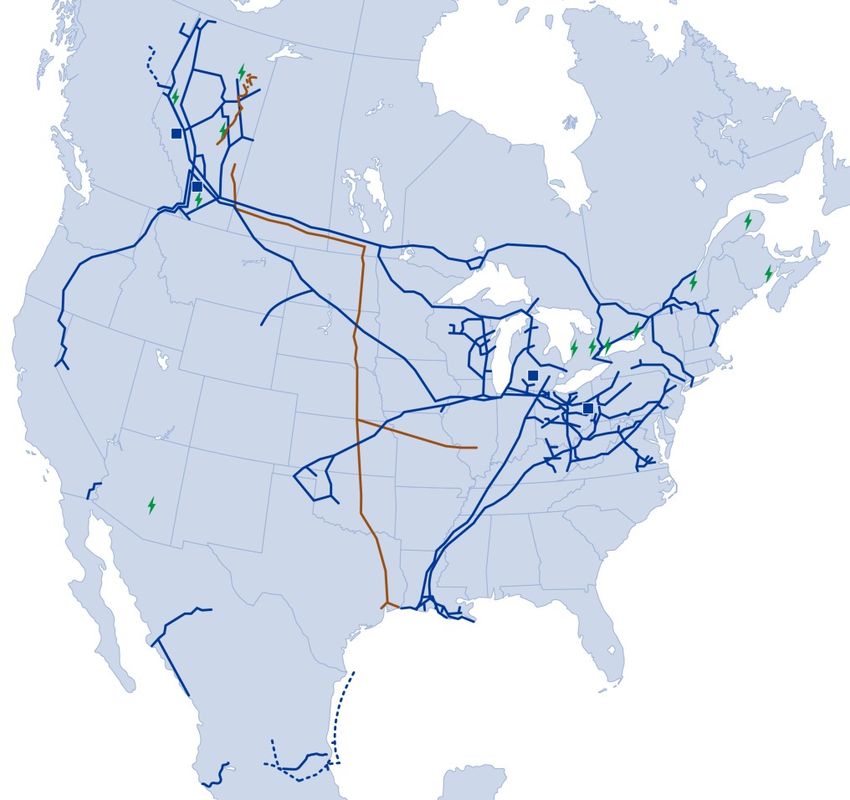
CIBC 2018 Whistler Institutional Investor Conference January 25, 2018 Russ Girling, President & CEO - TransCanada
TransCanada Today

                               • One of North America’s Largest
                                 Natural Gas Pipeline Networks
                                • 91,500 km (56,900 mi) of pipeline
                                • 653 Bcf of storage capacity
                                • 23 Bcf/d; ~25% of continental demand

                               • Premier Liquids Pipeline System
                                • 4,800 km (3,000 mi) of pipeline
                                • 555,000 bbl/d Keystone System
                                  transports ~20% of Western Canadian
                                  exports

                               • One of the Largest Private Sector
                                 Power Generators in Canada
                                • 11 power plants, 6,100 MW
                                • Primarily long-term contracted assets
 Portfolio of Complementary
Energy Infrastructure Assets   • Enterprise Value Over $100 billion
CIBC 2018 Whistler Institutional Investor Conference January 25, 2018 Russ Girling, President & CEO - TransCanada
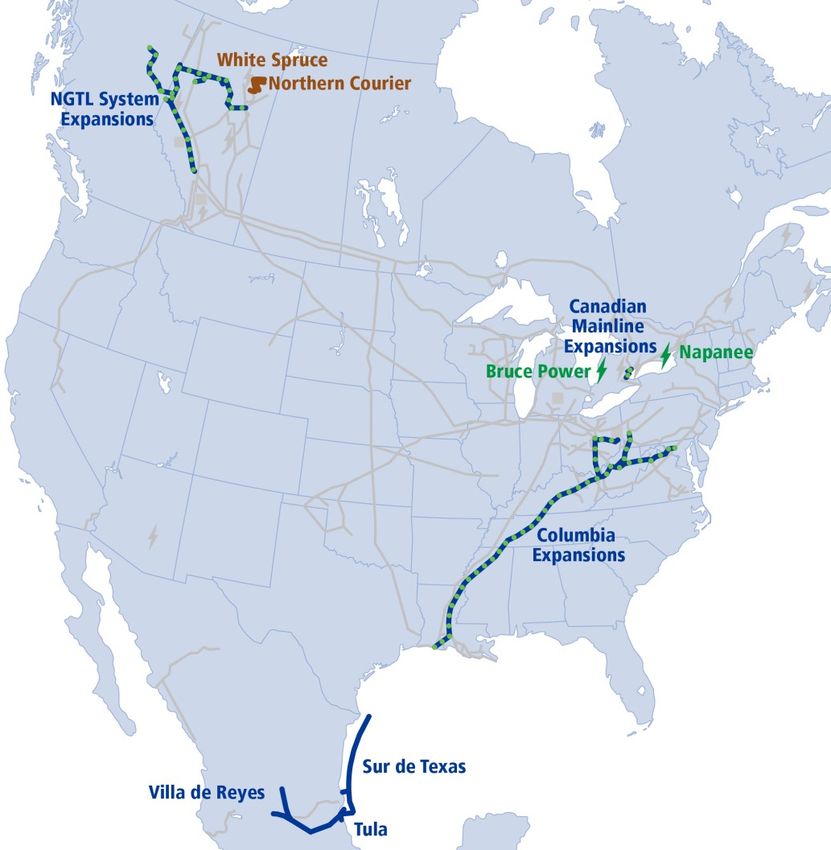
Advancing $24 Billion Near-Term Capital Program
                                                                                                                                                Estimated      Invested to       Expected
                                                                                                                               Project
                                                                                                                                               Capital Cost*      Date       In-Service Date*
                                                                                                               Northern Courier                      1.0           1.0          In-Service
                                                                                                               Rayne XPress                       US 0.4        US 0.4          In-Service
                                                                                                               Gibraltar                          US 0.3        US 0.2          In-Service
                                                                                                               Modernization l                    US 0.2        US 0.2            2017
                                                                                                               NGTL System                           2.3           1.5            2017
                                                                                                               Canadian Mainline                     0.5           0.2         2017-2019
                                                                                                               NGTL System                           4.8           0.5         2018-2021+
                                                                                                               Leach XPress                       US 1.6        US 1.3            2018
                                                                                                               WB XPress                          US 0.8        US 0.3            2018
                                                                                                               Mountaineer XPress                 US 2.6        US 0.4            2018
                                                                                                               Cameron Access                     US 0.3        US 0.2            2018
                                                                                                               Gulf XPress                        US 0.6        US 0.2            2018
                                                                                                               Tula                               US 0.6        US 0.5            2018
                                                                                                               Villa de Reyes                     US 0.6        US 0.4            2018
                                                                                                               Sur de Texas                       US 1.3        US 0.7            2018
                                                                                                               White Spruce                          0.2             -            2018
                                                                                                               Napanee                               1.1           0.9            2018
                                                                                                               Modernization ll                   US 1.1        US 0.1         2018-2020
                                                                                                               Buckeye XPress                     US 0.2             -            2020
                                                                                                               Other U.S. Gas                     US 0.4        US 0.1         2017-2020
                                                                                                               Bruce Power Life Extension            1.0           0.2         Up to 2020+
                                                                                                               Foreign Exchange Impact
                                                                                                                                                     2.8           1.2              -
                                                                                                               (1.25 exchange rate)
                                                                                                               Total Canadian Equivalent            24.7          10.5

* TransCanada share in billions of dollars. Certain projects are subject to various conditions including corporate and regulatory approvals.
CIBC 2018 Whistler Institutional Investor Conference January 25, 2018 Russ Girling, President & CEO - TransCanada
Columbia Acquisition & Near-term Capital Program Drive Significant Growth

                                                                                                                                         ~$9.5 Billion
                                                                                                                                           Merchant Energy
                                                                                                                         ~10%             Contracted Energy

                                                                                                                         CAGR
                                                                                                                                           Liquids Pipelines

                                                                                                                                         Mexico Natural Gas
                                                                                                                                             Pipelines
                                                                                                      $5.9 Billion
                                                                                                      Merchant Energy

                                                                                                    Contracted Energy
                                                                                                                                           U.S. Natural Gas
                                                                                                     Liquids Pipelines                        Pipelines

                                                                                              Mexico Natural Gas Pipelines
                                                                                                    U.S. Natural Gas
                                                                                                       Pipelines

                                                                                                   Canadian Natural Gas                  Canadian Natural Gas
                                                                                                        Pipelines                             Pipelines

                                                                                        2015 Comparable EBITDA                      2020E Comparable EBITDA
                     Over 95% of Comparable EBITDA to come from Regulated or
                                   Long-term Contracted Assets
*Comparable EBITDA is a non-GAAP measure. See the non-GAAP measures slide at the front of this presentation for more information.
CIBC 2018 Whistler Institutional Investor Conference January 25, 2018 Russ Girling, President & CEO - TransCanada
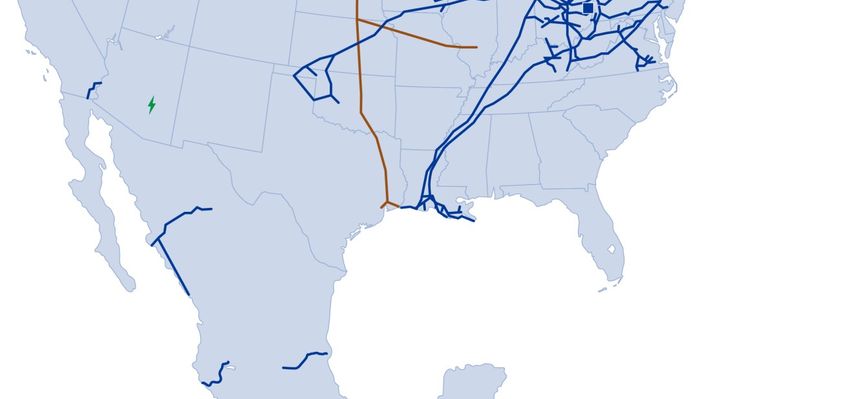
Funding Program Through 2020

$Billions
  30                                                                          2018 – 2020 Outlook
                                                 Portfolio Management,
                                               ATM (as appropriate) & Other
                                                                              Numerous Levers Available to Fund
  25                                               Hybrid Securities &        Near-Term Capital Program
                                                    Preferred Shares
            Dividends & NCI                      Senior Debt, Commercial      • Strong, predictable and growing cash flow
             Distributions                            Paper & Cash
                              DRP Proceeds                                      from operations
  20
                                                                              • Dividend Reinvestment Plan
                                                                              • Access to capital markets including:
  15
                Capital                                                          • Senior debt
               Program
              (including
             development
                                  Funds                                          • Hybrid securities and preferred shares
  10            costs &
                              Generated from

             maintenance
                                Operations
                                                                              • Portfolio management including possible
               capital)
                                                                                dropdowns to TC PipeLines, LP
   5                                                                          • Potential further project recoveries
                                                                              • At-The-Market (ATM) program, as appropriate
   0
                            Funding Program Manageable
       Completion of $24 Billion Near-Term Capital Program Does Not Require
                                   Discrete Equity
CIBC 2018 Whistler Institutional Investor Conference January 25, 2018 Russ Girling, President & CEO - TransCanada
Visibility to Growth Beyond 2020

                                                                                    Natural Gas Pipelines
                                                                                       • NGTL/Columbia/Mexico expansions
                                                                                         (assets that will produce recurring growth opportunities)
                                                                                       • Coastal GasLink (~$4.8 billion)

                                                                                    Liquids Pipelines
                                                                                       • Keystone XL (~US$8 billion)
                                                                                       • Keystone XL could facilitate further development:
                                                                                            • Grand Rapids Phase II
                                                                                            • Heartland Pipeline
                                                                                            • Keystone Hardisty Terminal

                                                                                    Energy
                                                                                       • Bruce Power Life Extension (~$5.3 billion*)
                                                                                       • Pursue growth in contracted power

                                                                                                  Over $20 Billion of Future Growth
                                                                                                           Opportunities
*TransCanada share in billions of dollars; Bruce Power in 2014 dollars. Certain projects are subject to various conditions including corporate and regulatory approvals.
Dividend Growth Outlook Through 2021

Annual Growth at the Upper End of 8 to 10 Percent Expected to End of Decade
            Further 8 to 10 Percent Growth Anticipated in 2021

                                                                             +8 to 10%

                           2.50
                 2.26
      2.08

      '15        '16        '17       '18E       '19E      '20E       '21E

             Supported by Expected Growth in Earnings and Cash Flow
                     and Continued Strong Coverage Ratios
Key Takeaways

                    Track Record of Delivering
                   Long-Term Shareholder Value

                   14% average annual return since 2000

      Visible                                                Strong
                               Attractive, Growing
  Growth Portfolio                                      Financial Position
                                    Dividend
     $24 billion to 2020
                                     4.1% yield         ‘A’ grade credit rating
 Additional opportunity set
                                8-10% expected CAGR   Numerous levers available to
includes over $20 billion of
                                    through 2021          fund future growth
  medium to longer-term
          projects

  Performance Highlights Diversified, Low Risk Business Strategy
CIBC 2018 Whistler Institutional Investor Conference
January 25, 2018

Russ Girling, President & CEO
You can also read