COMPANY PRESENTATION Milan, March 16th 2016 - Panariagroup
←
→
Page content transcription
If your browser does not render page correctly, please read the page content below
COMPANY PRESENTATION
      Milan, March 16th 2016

                       1
TABLE OF CONTENTS

The Group

Financial Results

Europe & Usa

Appendix

                                  2
THE GROUP

            3
THE GROUP
Profile
Panariagroup designs, manufactures and
distributes floor and wall ceramic tiles since 1974
The Group is specialized in the production of
porcelain grès tiles with a complete positionining
in the high-end and deluxe market segment
It closed 3 acquisitions in the last 10 years
becoming one of the major Italian groups with an
international scope, three manufacturing plants in
Italy, two in Portugal and one in the US.
The Group distributes its products through 8
brands in more than 100 Countries, thanks to
sales channels composed by mid size distributors
and a chain of 22 directly managed branches in
USA.
Stock is traded on Milan Stock Exchange The Group relies on State of the Art plants
since 2004
The JV in India with Asian Granito India Ltd will
Employs 1.625 people worldwide allow the Group to have a direct presence in the
emerging markets
4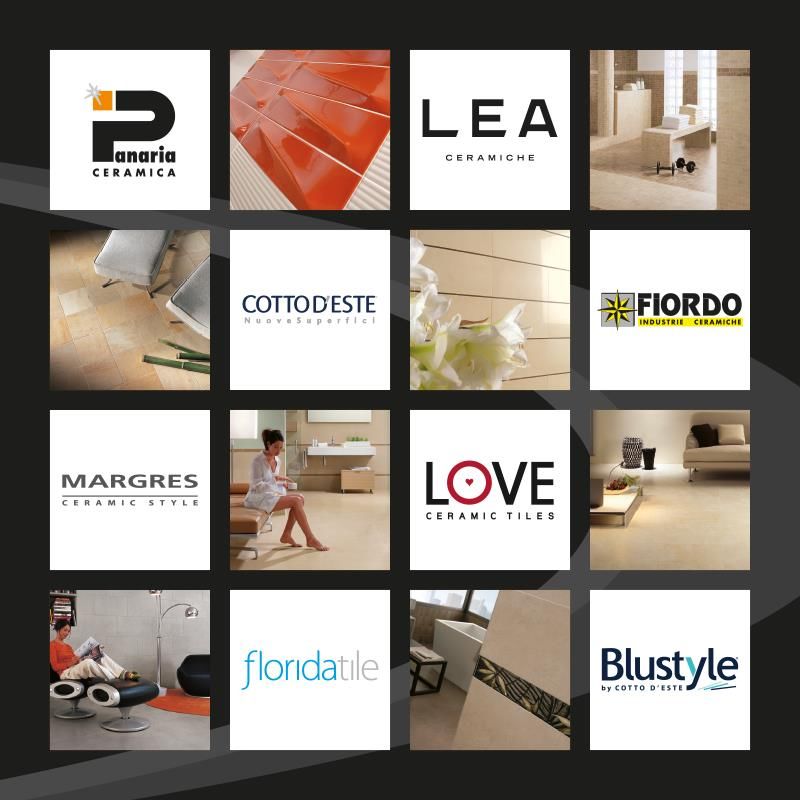
THE GROUP
                                          The growth and the consolidation

•   Following the IPO (2004), the Group targeted an international expansion that sustained
    the impressive growth of 2006;

•   2007 has been an year of consolidation of the structure after the rapid growth through
    acquisitions of the previous years. Despite the critical situation of the US market and the
    devaluation of US Dollar the company maintained the important level of sales reached in
    2006;

•   From 2008 to 2012 Sales reduction due to a weak trend of the worldwide economy in line
    with the overall market trend;

•   In 2013 Overall Sales reduction of 2,8% due to the decline of Europe and Italy partially
    offset by the grew in the US Market

•   In 2014 >6% increase in sales thanks to a >10% growth in US and Portugal

•   In 2015 +18% growth in sales: +10% BU Italy, +32% BU USA and +18% BU Portugal

                                                                                            5
PANARIAGROUP
                                                                             Profile

    Panariagroup is a listed company world leader:

                        FINANCIAL                    • Historycal
                                                                             Leverage
                        STRENGTH                     Performance

Premium • High-end         LUXURY          TECHNOLOGY •             State of Art Plant
Price     products         BRAND           & INNOVATION

                                   WORLD WIDE

                                                                          Production
           Sales                                                        facilities in key
                                                                           countries

                                                                                     6
PANARIAGROUP
                                                                         Success Factor

     FINANCIAL                                                  WORLD
     STRENGTH                                                   WIDE
  Italian Stock Exchange                   Production facility: USA, Italy, Portugal and India (JV)

  International funding                    Distribution all over the countries

                                                              TECHNOLOGY &
     LUXURY BRAND
                                                               INNOVATION
Global position of the brand in the high and        Digital   Print   Capacity   and   State   of   the     Art
luxury segments                                   Technology

High quality standards in the research and          Extremely     innovative     productive    system       for
selection of raw materials                        production of Gres Laminated Porcelain

Strong R&D activity, aimed at product and
manufacturing process innovation

Focus on service, delivery efficiency, careful
customer relationship

                                                                                                        7
FINANCIAL STRENGTH

                                       In 2011 Capital Investment for €19 million, €7 millions
                                       are dedicated to build second line of Gres Laminated
                                       Porcelain (“Kerlite”) in the Fiorano plant in Italy;

                                       In 2012 invested 7,7M€ in US for a new porcelain line;

                                       In 2013 Capital Investment for 16,6M€: 10,6M€ in
                                       Italy; 3,3 M€ in Portugal and 2,7M€ invested in US;

    WE ARE READY TO TAKE WORLD         In 2014 Capital Investments for 13,2M€;
  ECONOMIC RECOVERY THANKS TO OUR
                                       In 2015 38M€ of Capital Investment: 17M€ in Italy
INVESTMENT DURING THE CRISIS AND OUR
                                       (Line 3 Slim Tiles), 13M€ in USA (new complete
        FINANCIAL STRENGHT
                                       manufacturing line and SAP project) and 7M€ in
                                       Portugal.

                          +18%

                                                                                              8
Group Plants                  WORLD WIDE

                               53%
                                                                        ITALY
                                                         Panariagroup #1 plant
                                                         Finale Emilia (MO)
                        31%

            16%
                                            Italy
                  USA     Portugal
                                                         Panariagroup #2plant
                                                         Toano (RE)
                                                         Panariagroup #3plant
                                                         Fiorano (MO)

 Capacity: 23,8 millions sqm

              USA                                      PORTUGAL
Panariagroup #6 plant          Panariagroup #4 plant
Lawrenceburg                   Ilaho (P)
(Kentucky, USA)
                               Panariagroup #5 plant
                               Aveiro (P)

                                                                                 9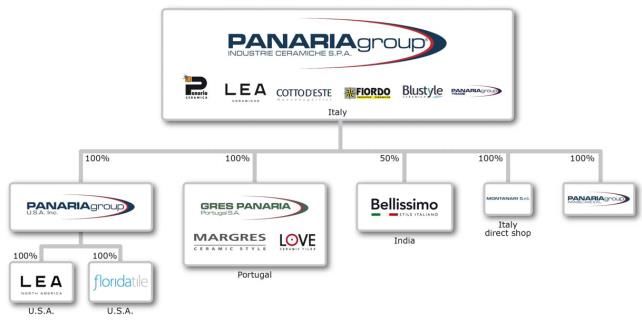
WORLD WIDE
                                   Group Sales

                           31%

                                     19%

                          Europe     Italy
           41%

    North/South America                      9%

                                        Other Countries
                                        (Asia &Oceania)

Sales 2015: € 343 Millions

                                                                   10
THE GROUP
The Brand Portolio
LUX
positioning
WORLDWIDE
The Group offers a wide range of product lines
Geographic range
Eight different brands, all well known
Each brand has its own specific and distinctive characteristics, in order to meet the
needs of the more sophisticated customers
In 2012 a new brand has been created called Bellissimo, dedicated to the Indian market
11FINANCIAL RESULTS
12FINANCIAL RESULTS
Consolidated Income Statement
Euro/000 2011 % 2012 % 2013 % 2014 % 2014 - 09 % 2015 - 09 %
Gross revenues 291.397 280.778 272.971 290.679 218.062 259.447
Growth 2,2% -3,6% -2,8% 6,5% 19,0%
Value of Production 303.636 100% 297.917 100% 270.463 100% 298.247 100% 217.487 100% 268.724 100%
Growth 3,8% -1,9% -9,2% 10,3% 23,6%
EBITDA 25.627 8,4% 21.096 7,1% 14.044 5,2% 21.038 7,1% 14.666 6,7% 24.223 9,0%
Growth -9,3% -17,7% -33,4% 49,8% 65,2%
EBIT 4.955 1,6% -5.546 -1,9% -6.845 -2,5% 1.920 0,6% 661 0,3% 9.265 3,4%
Net income 1.551 0,5% 1.591 0,5% -7.851 -2,9% -1.840 -0,6% -1.983 -0,9% 4.420 1,6%
• Volume increase has been main driver for the growth of the Consolidated Operating
Profit
• Energy Costs had a positive impact for 1.7M€
13FINANCIAL RESULTS
Consolidated Balance Sheet
Euro/000 2011 2012 2013 2014 2015 - 09
Goodwill 12.789 8.139 8.139 8.139 8.139
Intangible assets 2.697 2.425 2.149 2.202 4.013
Tangible assets 92.221 91.625 90.358 89.851 99.594
Financial fixed assets 5 361 358 458 187
Fixed assets 107.712 102.550 101.004 100.650 111.933
Current assets 231.567 232.677 204.812 208.791 231.548
Current liabilities (88.812) (85.231) (74.325) (83.752) (99.045)
Net Working Capital 142.755 147.446 130.487 125.039 132.503
Assets and Liabilities due after the year (12.340) (4.154) 2.521 1.723 (2.536)
NET CAPITAL EMPLOYED 238.127 245.842 234.012 227.412 241.900
Net Financial Position 84.874 92.147 90.852 80.292 86.570
Shareholders' equity 153.253 153.695 143.160 147.120 155.330
Dividend Distributed - - - - -
14FINANCIAL RESULTS
Net Financial Position
Euro/Million 2011 2012 2013 2014 2015 - 09
Short - term financial assets 3,1 4,6 10,0 2,9 5,9
Short-term financial debt -49,3 -37,1 -44,9 -39,0 -52,6
Mid-long term financial debt -38,7 -59,6 -55,9 -44,2 -39,9
Net financial debt -84,9 -92,1 -90,8 -80,3 -86,6
• The Net Financial Position remain inline with 2014 despite big capital investments.
15EUROPE & USA
16EUROPE
Description
Includes 7 brands and 5 production plants in Italy and in Portugal
Has a well established presence in the European market;
All brands are positioned in the high end and deluxe market segment;
The average selling price in both markets is almost double of the average of the
market;
In 2015 the Italian Business Unit has a growth in Sales for +10% which brought the
EBITDA margin to 4,3% (+1,2%);
In 2015 the Portoguese Business Unit grow in Sales >18% wich brought the EBITDA
margin to 11,6% (+1,5%)
17EUROPE
Outlook 2016 and Projects
• Further Growth in Sales Volume (>10%);
• Focus on defending market share in Portugal and rationalising commercial
networks in Italy;
• EBITDA margin increase thanks to Sales Volume Growth;
• Introduce new product lines => maintain average selling price;
• Continue to invest in new Technology (big size format, digital printers and energy
cost reduction focus);
• With #27 machines installed Panariagroup is a leader in terms of Digital Print
Capacity
18USA
Locations
Includes the acquisition of Florida Tile and in particular:
Florida Tile brand;
The new production plant based in Kentucky;
Manufacture in the US plant of Italian brand’s products;
22 directly managed branches mainly located in the East coast;
The distribution center located near the plant in Kentucky.
19USA
Competitive Advantage
• Production facility and Distribution Center in US territory;
• #2 World class Porcelain lines (third line will be completely installed during
2016);
• Manufacture in the US plant of Italian brand’s products;
• #5 Digital Print Machines;
• State of the Art technology;
• Purchasing synergies with Panariagroup;
• R&D activity in collaboration with Italy;
• 22 fully owned branches
20USA
Outlook 2016 and Projects
• Sales growth >10%;
• Improvement of the product portfolio with new porcelain lines;
• Strengthening of the distribution network:
Mid size distributors => high level of service;
Directly managed branches => better control;
• Commercial Relationship with Home Centers will start
21INDIA (JV)
Outlook 2016 and Projects
• Estimated Sales FY March 2016 3M€
• Sales Budget March 2017 4,5M€;
• Improvement of the product portfolio with new porcelain lines from Italy
(included slim tiles products) and further “Made in India” products;
• Enforce the Distribution network:
Small Retailers;
B2B (builder, architectural projects);
Big Retailers/Importer supplied from Indian warehouses and ex works
from Italy
• Develop Export channel from India
22APPENDIX
23APPENDIX
Share Performance
24APPENDIX
Managements & Contacts
Giuliano Pini Corporate CEO
Renato Martelli Corporate Controller– Investor Relator
Bartolomeo Vultaggio Corporate Internal Audit – Investor Relator
PANARIAGROUP INDUSTRIE CERAMICHE S.P.A.
Management Center:
Via Cameazzo, 21
Fiorano Modenese (MO)
Tel. +39 0536 915211 - Fax +39 0536 915204
info@panariagroup.it
25You can also read