"Do my qPCR calculation", a web tool - Bioinformation
←
→
Page content transcription
If your browser does not render page correctly, please read the page content below
                                                www.bioinformation.net
                                                                                                                    Research Article
                                                      Volume 15(5)
"Do my qPCR calculation", a web tool
Jérémy Tournayre*,1, Matthieu Reichstadt2, Laurent Parry1, Pierre Fafournoux1, Céline Jousse*,1
1Université
          Clermont Auvergne, INRA, UNH, Unité de Nutrition Humaine, CRNH Auvergne, F-63000 Clermont-Ferrand, France;
2Université
          Clermont Auvergne, INRA, VetAgro Sup, UMR1213 Herbivores, Unité Mixte de Recherche sur les Herbivores, F-63000
Clermont-Ferrand, France; Jérémy Tournayre - E-mail: Jeremy.tournayre@inra.fr; Celine Jousee - E-mail: celine.jousse@inra.fr;
*Corresponding authors

Received April 24, 2019; Accepted May 3, 2019; Published May 15, 2019
                                                                                                              DOI: 10.6026/97320630015369
Abstract:
In order to automatically process qPCR raw data, we present the tool "Do my qPCR calculation". We offer a website to automatically
calculate the data normalization and represent the different samples graphically in an Excel file. This tool is also available on Github for
installation and local use with or without web interface.

Keywords: qPCR, automation tool, web server

Availability: http://147.99.156.182/do_my_qPCRcalc/; The source code: https://github.com/JeremyTournayre/do_my_qPCRcalc

Background:
The fluorescence-based quantitative real-time PCR (qPCR) is a                   QPCR and LinRegPCR. QPCR requires an install on a server and a
molecular biology technique that is routinely used in laboratories. It          license request [1]. LinRegPCR is an executable running only on
quantitatively monitors, in real-time, the amplification of a targeted          Windows [2]. Unfortunately, it does not propose an example or
DNA (or cDNA after reverse transcription of a target RNA)                       template file to understand how the input file should be processed.
molecule during the PCR. The quantification is based on the                     Finally, to our knowledge, there is no free tool available on any
number of cycles of PCR at which the fluorescence exceeds a given               plateform without the need to install a particular device to analyze
threshold (Cq). Softwares associated with qPCR apparatus provides               qPCR data. That's why we present our tool: "Do my qPCR
Cq for each sample and usually propose a tool for calculation for               calculations".
quantification and normalization for each sample. However, the
use of such specific software often requires a license and/or is                "Do my qPCR calculations" can be used through a website hosted
restricted to a given operating system. For example, CFX Maestro                on a server that provides computing power. "Do my qPCR
™ Software license from Bio-Rad goes from 150 euros for the Mac                 calculations" allows, from Cq, to calculate almost instantaneously in
version to 1000 euros for the Windows version (catalog price seen               an excel file the relative quantities of RNA normalized by a
on 08/02/2019).                                                                 reference gene. It allows taking into account groups of samples to
                                                                                perform student test between the control group and experimental
Given these constraints, researchers very often extract Cq from the             groups. Also the tool makes histograms of each result. Input data
computer connected to the thermocycler in order to carry out their              will only be used for generate results and not for any further
own calculations in their own spreadsheet (for example Excel,                   purpose. They are automatically deleted from the server when the
LibreOffice, ...) which is tedious. To go further, researchers have             Excel file is generated. We use the recommended MIQE
built free tools to perform automatic calculations: for example,                nomenclature [3], i.e Cq, reference gene.

ISSN 0973-2063 (online) 0973-8894 (print)
                         369
                                                                                                                    ©Biomedical Informatics (2019)
Bioinformation 15(5): 369-372 (2019)

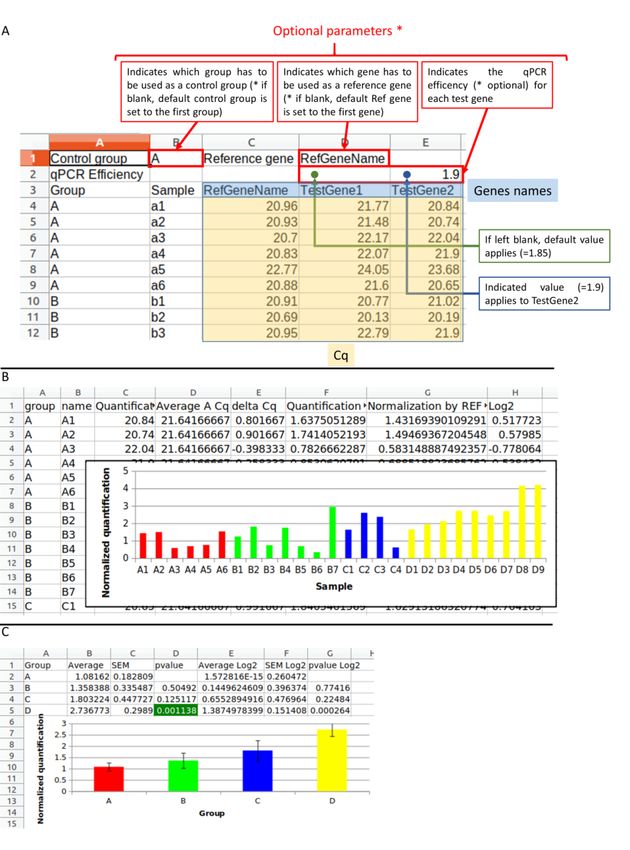
Figure 1: A) The input data has to be in a file in .tsv, .xls, .xlsx. or .odt format or written in the web form. The first two rows contain
options. The control group is defined in B1 cell: the "A" group is chosen. The reference gene in D1 cell: the "RefGeneName" gene is selected.
The second row allows defining the qPCR efficiency for each gene written on the third row. On the third row there are two column headers:
"Group" and "Sample" and then there are the genes: "RefGeneName", "TestGene1", "TestGene2". The other rows correspond to the data
table: sample according to the Cq. Submitting this file to "do my qPCR calculation" allows you to obtain the result file in Excel format. B)
The Excel file contains the normalized Cq for each sample with histograms. C) The Excel file also contains the average results and the
student test for each experimental group between the control groups.


ISSN 0973-2063 (online) 0973-8894 (print)
                        370
                                                                                                            ©Biomedical Informatics (2019)
Bioinformation 15(5): 369-372 (2019)

Methodology                                                                        efficiency set in the options (eff) and the delta Cq (E) with the
"Do my qPCR calculation" is built from Perl with librairies:                       formula: eff^(E), (G) normalized quantification by the reference
Excel::Writer::XLSX, Spreadsheet::ParseExcel and Statistics::TTest.                gene, and (H) the log2 corresponding to the normalized
The ssconvert tool is used to convert xlsx/xls/ods files into .tsv                 quantification by the reference gene set in log2. The average tab
format.The web interface is a PHP script containing HTML, PHP,                     contains: (A) groups, (B) average of the samples of the group, (C)
CSS and javascript with jQuery, Jexcel and jQuery-csv libraries.                   SEM, (D) pvalue of the student test between the experimental
                                                                                   group and the control group, (E, F and G) the results calculated
Using the tool                                                                     with the log2 data. In each analysis histograms are generated to
                                                                                   visualize the data.
Figure 1 shows the input and output using an example for the tool
                                                                                   Conclusion:
Input: "Template" contains a description of the input file. We offer               Our tool "Do my qPCR calculation" was created to provide to the
one example, ready to be submitted, that can be downloaded in                      scientific community a simple and efficient way to deal with qPCR
tabulated separated value .tsv, Excel or in OpenOffice/LibreOffice                 data. In order to make it accessible to a maximum of users the tool
format. The first two rows permit to specify parameters such as the                is available on a website accessible on any Internet browser
control group, the reference gene and the qPCR efficiency for each                 commonly used whatever the operating system and type of
gene. By default: the first group corresponds to the control group,                platform, i.e Windows, Mac... Moreover our tool provides results as
the first gene corresponds to the reference gene and the efficiency is             a spreadsheet that can be dealt with any spreadsheet software. This
set to 1.85 (92.5% efficiency). If applicable, the user can indicate a             tool is meant to be further developed if needed by taking into
custom efficiency right above the gene name. The data has to be                    account the comments of users while keeping the tool easy to use.
given in column with the following headers: "Group", "Sample" and
the different amplified genes. Missing values (other than a number,                Acknowledgment:
i.e NA, empty...) may be present in the file; they will not be taken               The Institut de Recherches Servier provided a financial support to
into account into calculations.                                                    the Jérémy Tournayre Ph.D. studies. The Centre National pour la
                                                                                   Recherche Scientifique (CNRS) provided support for C.J., and P.F.
Output: The generated excel file contains two tabs for each
analyzed gene. One tab contains the analysis done per sample and                   References:
the next tab contains the average for each group. In the case of the               [1] Pabinger S et al. BMC Bioinformatics. 2009 10:268. [PMID:
analysis by sample, the table contains: (A) groups, (B) name of each                    19712446]
sample, (C) Cq corresponding to the initial data, (D) average Cq of                [2] Ruijter JM et al. Nucleic Acids Res. 2009. 37:e45. [PMID:
the control samples which permit to calculate (E) the delta Cq                          19712446]
calculated as (D) - (C), (F) quantification calculated using the                   [3] Bustin SA et al. Clin Chem. 2009. 55:611. [PMID: 19246619]

                                                                                                                           Edited by P Kangueane
                                                                                    Citation: Tournayre et al. Bioinformation 15(5): 369-372 (2019)
       License statement: This is an Open Access article which permits unrestricted use, distribution, and reproduction in any medium, provided
                         the original work is properly credited. This is distributed under the terms of the Creative Commons Attribution License

ISSN 0973-2063 (online) 0973-8894 (print)
                              371
                                                                                                                      ©Biomedical Informatics (2019)
Bioinformation 15(5): 369-372 (2019)

                                                Journal

ISSN 0973-2063 (online) 0973-8894 (print)
       372
                                                                  ©Biomedical Informatics (2019)
Bioinformation 15(5): 369-372 (2019)

You can also read